
Data Flow Diagrams (DFDs) serve as essential tools for system designers. They help visualize how data moves through a system. This enables them to locate system inefficiencies and create performance-enhancing systems.
DFDs can be used for software development activities. It also supports business process modeling and system analysis efforts. We have created a complete guide to help you understand the data flow diagram.
In this article
What Is a Data Flow Diagram?
Data Flow Diagrams are visual representations that help understand the data flow within a system. It depicts how information moves between system elements. Besides, it helps to understand how data is processed. You also know how the system stores information while moving among various system components. DFDs are valuable tools in designing, analyzing, and improving systems.
Two basic classification categories in Data Flow Diagrams (DFDs). What are they?
- Logical DFDs
- Physical DFDs
Logical DFDs focus on system functions. It presents business operations without displaying technical implementation aspects. DFDs simplify the comprehension of system functions.
On the other hand, physical DFDs show the implementation structure of a system. They are illustrations of databases, software applications, hardware equipment, and participants. Physical DFDs show detailed information. It helps to understand the genuine structure of system components.
Data Flow Diagram Examples
Here are a few examples of different Data Flow Diagrams. The following examples present DFDs straightforwardly to illustrate how systems handle data processing.
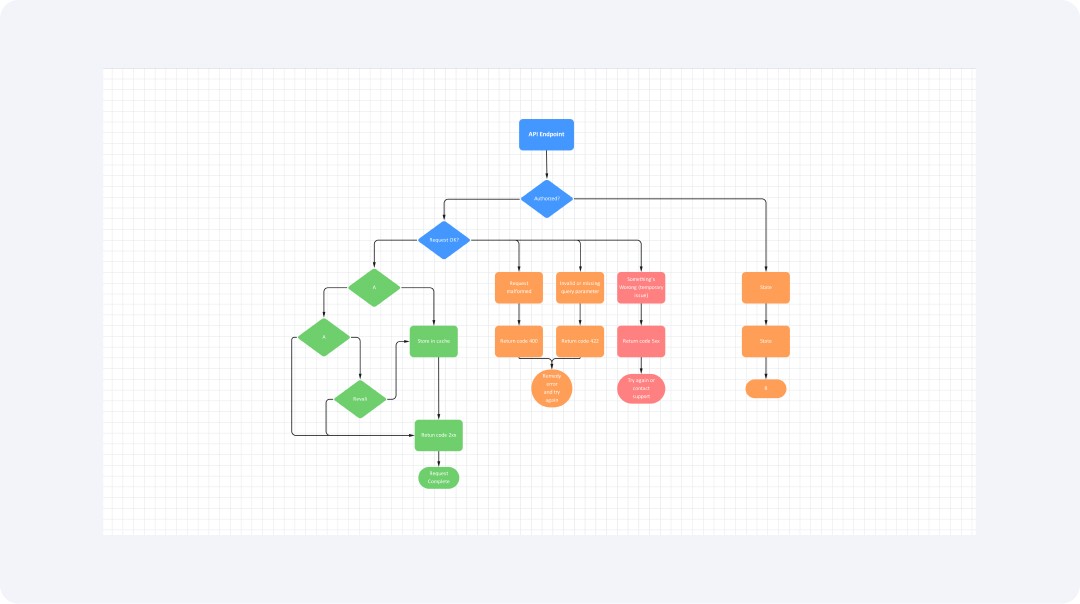
Data flow diagram for API
This data flow diagram shows how requests and responses move in an API system. It shows how requests are validated, processed, and how errors are handled. The diagram shows steps like checking valid parameters, fixing temporary issues, and returning HTTP status codes. For errors, it uses codes like 400, 422, and 5xx. For successful requests, it uses 2xx codes. It also depicts the process of caching data and retrying failed requests.
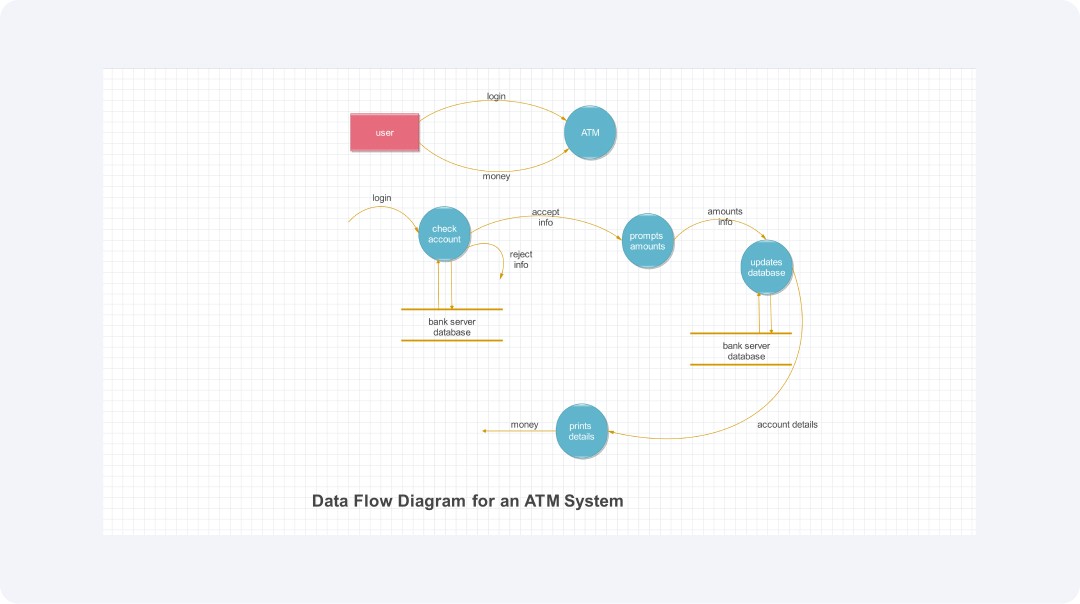
Data flow diagram for ATM
This data flow diagram for ATM represents the data flow in an ATM system. It includes user interactions like logging in, checking account details, and withdrawing money. The system talks to a bank server. It checks transactions, updates account balances, and deals with rejections. It also shows the flow of prompts and updates between the ATM and the database.
Data flow diagram for a call center
This data flow diagram for a call center depicts the data flow in a call center system. It includes managing customer orders, real-time dispatch requests, and inventory updates. The system connects to a web server, ERP, and databases. It manages customer info, service requests, and nightly updates. It shows how different parts, like the management system and the e-communications app, communicate.

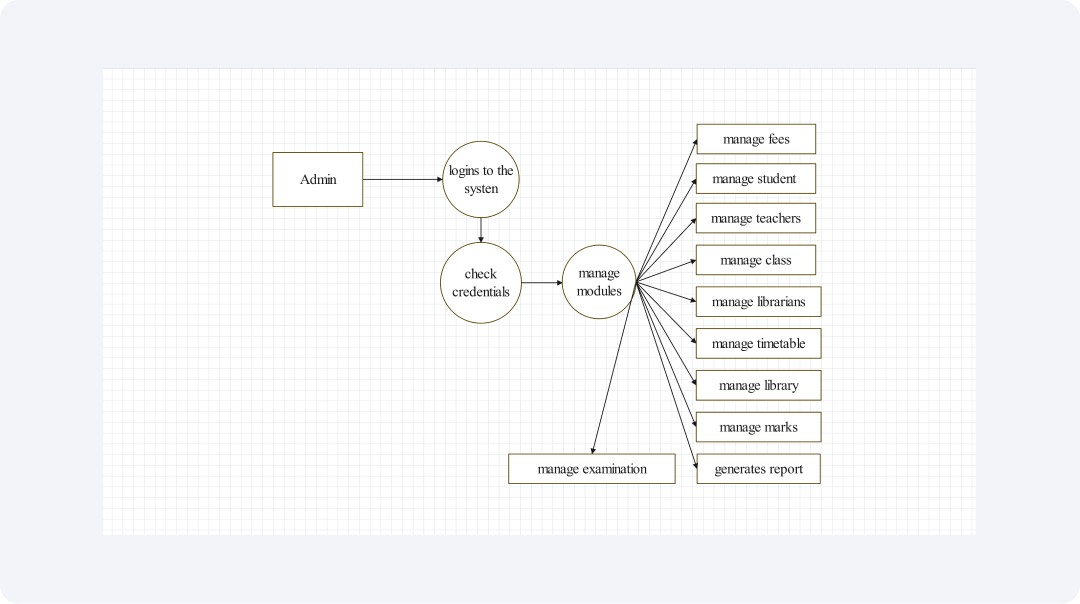
Data flow diagram for the admin college system
This data flow diagram shows the data flow for a college administration system. It involves handling student and teacher info, class schedules, library data, and exam scores. The admin can generate reports, manage fees, and update timetables. The system uses different modules and credentials. This helps manage college resources smoothly.
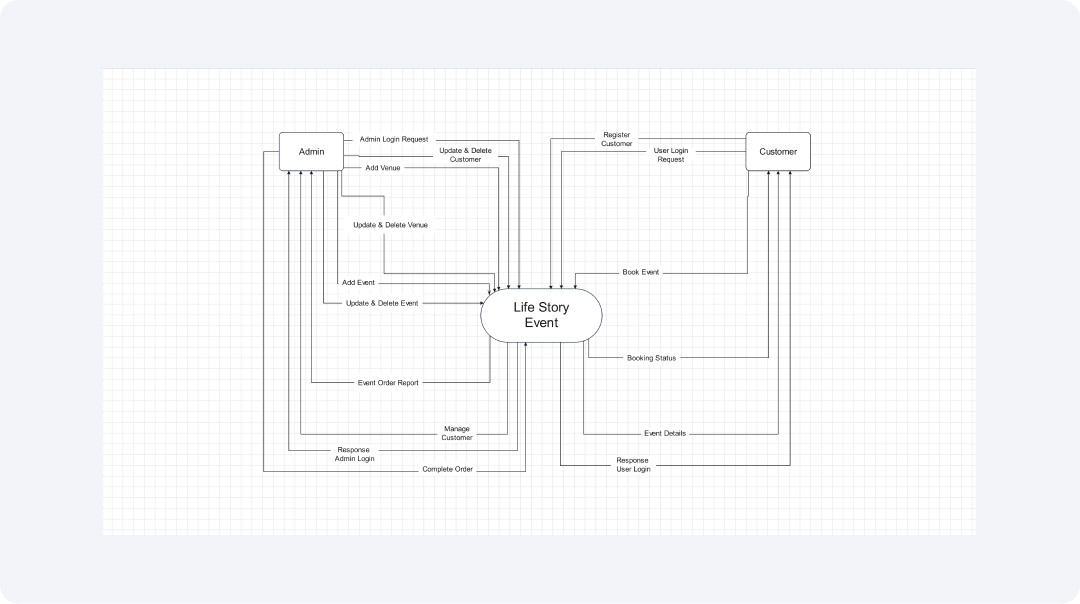
Data flow diagram for event management
This diagram illustrates the data flow in an event management system. It includes admin login requests, adding and updating events, and generating event order reports. The system processes orders and responds, ensuring that events are managed efficiently. It also shows the flow of updates and deletions within the event management process.
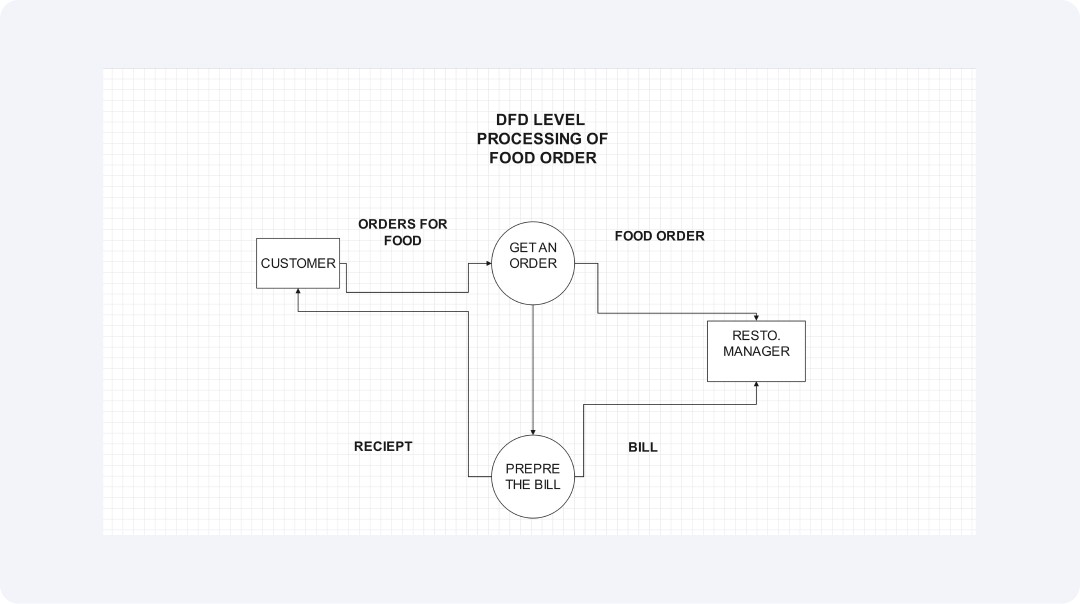
Data flow diagram for food ordering
This data flow diagram for food ordering depicts the data flow in a food ordering system. It involves the customer making an order. Then, the restaurant manager gets the order ready and creates a receipt or bill. The flow shows how customers interact with the restaurant. It highlights the steps from placing an order to making a payment.
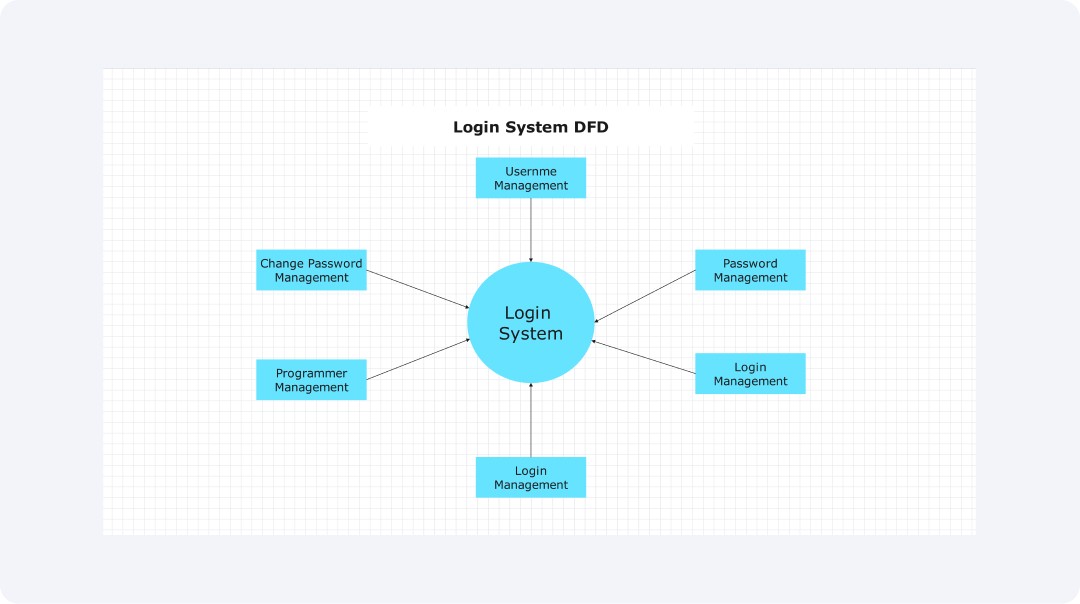
Data flow diagram for login
This data flow diagram illustrates the data flow in a login system. It involves entering a username and password. It also includes managing login details and changing passwords. The system works with management and programmers. It makes sure that user accounts and permissions are secure and well-managed.
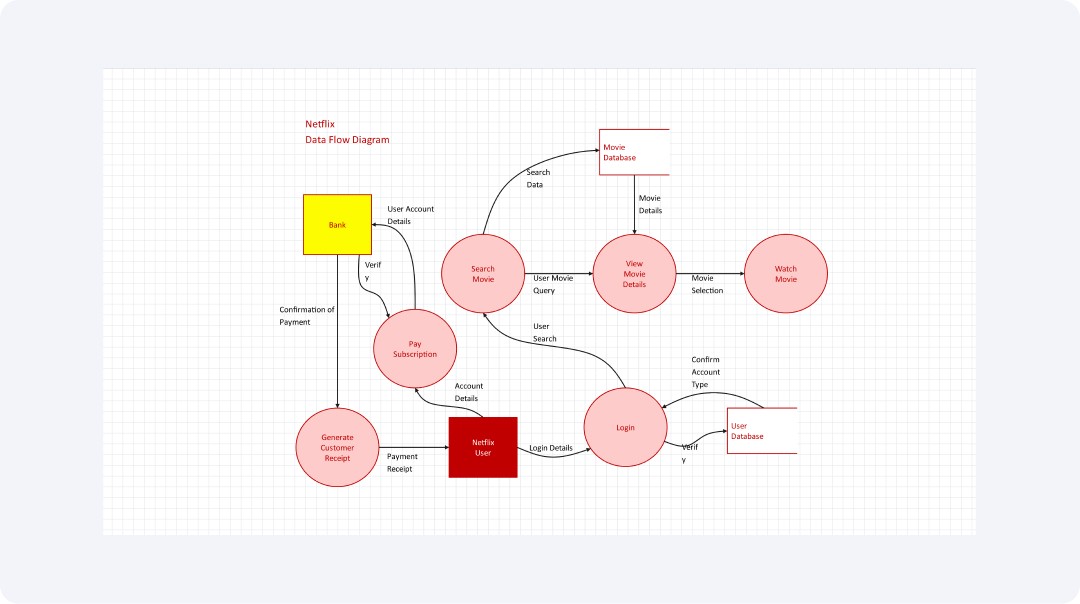
Data flow diagram for Netflix
This data flow diagram showcases the seamless journey of data through the Netflix network. It shows key steps: signing in, searching for movies, checking details, and streaming favorites. The system takes care of subscription payments and makes customer receipts. It also works with a user database to handle user information and preferences.
Components of Data Flow Diagrams
DFDs consist of several key components, each representing different system elements. These components represent the flow of data.
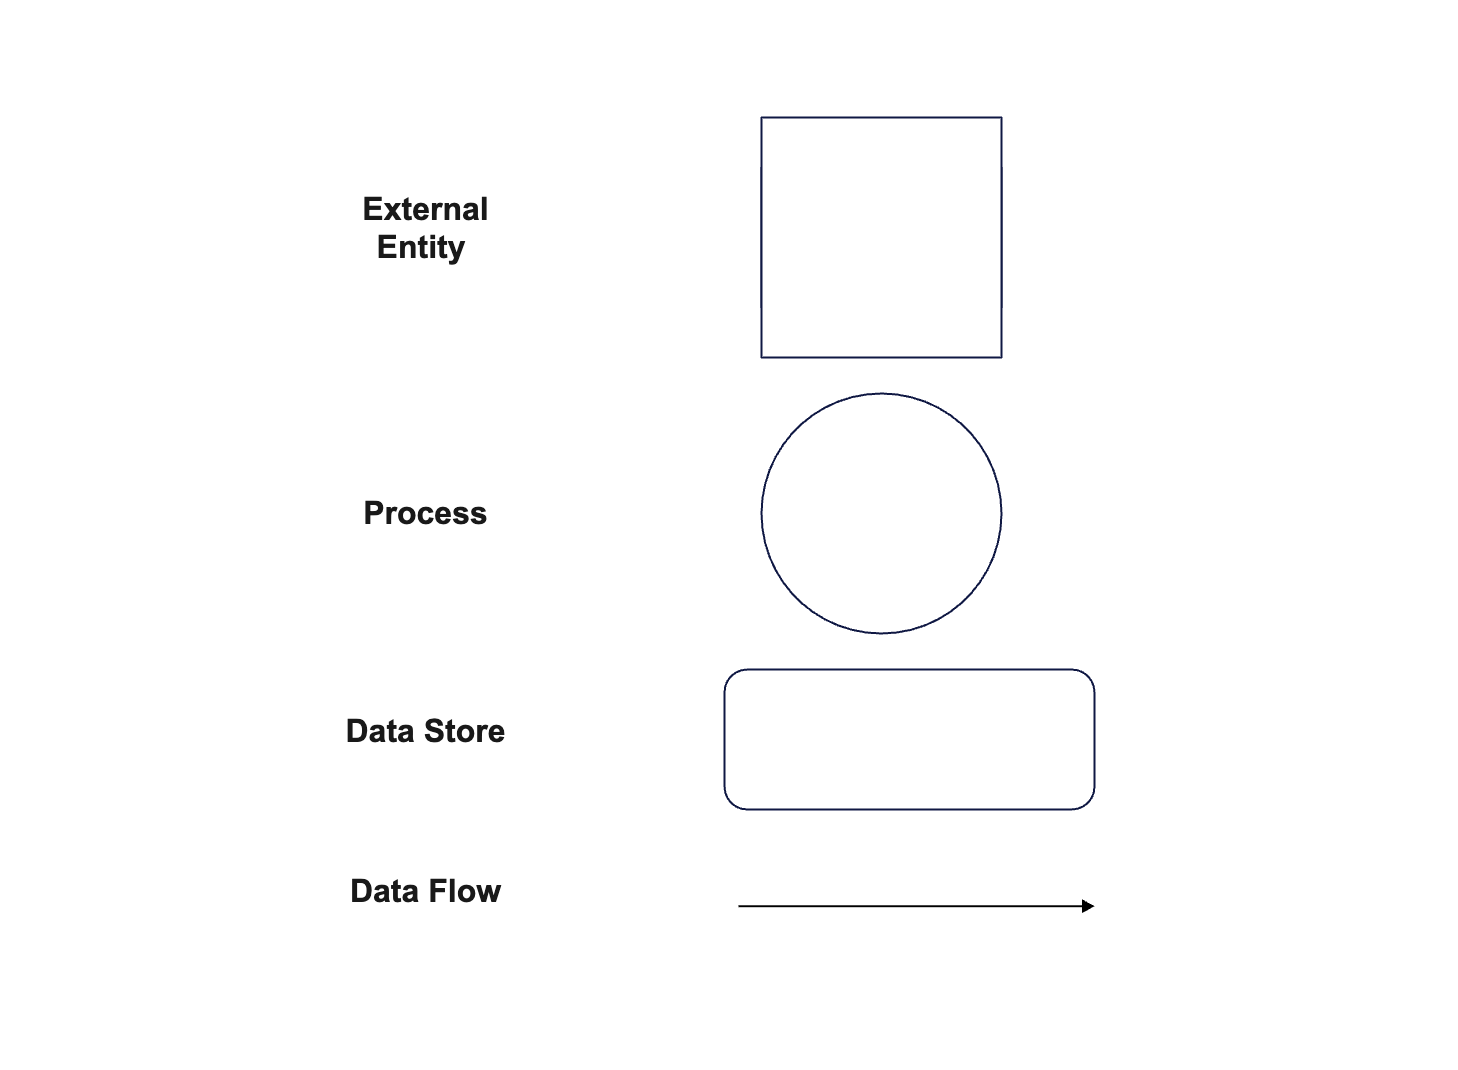
External Entities
External entities are sources or destinations of data outside the system. The system has various external entities that initiate system interactions with customers, suppliers, and external organizations. External entities mark both entry and exit boundaries for system data.
Processes
The system uses processes to execute transformations on its database information. The model presents the complete lifecycle. It involves data receipt and processing tasks and final output generation. The system processes three key functionalities: verifying orders, managing payments, and regulating inventory management. Processes are usually represented by circles or ovals in DFDs.
Data Stores
Data Stores are repositories where data is held for later use. They can represent databases, files, or any storage location within the system. Processes are usually represented by circles or ovals in DFDs.
Data Flows
Data Flows illustrate the movement of data between components. They are depicted as arrows. It shows the direction of data transfer between processes, data stores, and external entities. Properly mapping data flows helps identify bottlenecks and inefficiencies in a system.
DFDs are typically divided into different levels:
- Context Diagram (Level 0) – Shows the system as a single process interacting with external entities.
- Level 1, 2, etc. – Break down the system into more detailed processes.
How to Make a Data Flow Diagram?
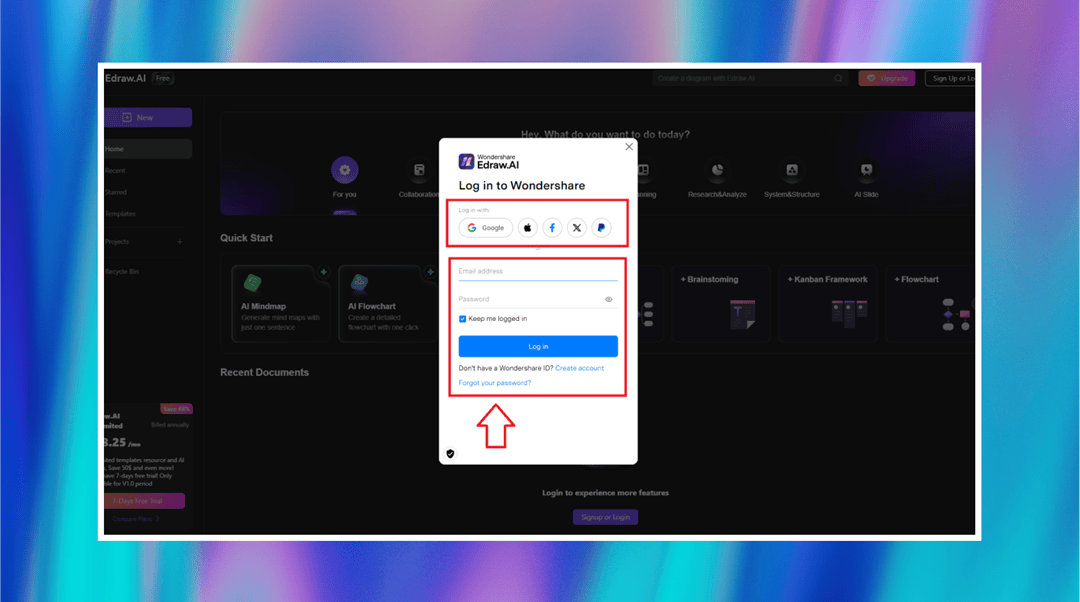
Step 1Sign in to Edraw.AI
A pop-up login window will appear, allowing you to log in using Google, Apple, Facebook, X, or PayPal, or by providing your email and password. New users can register using these options or use Create account. Once logged in, you can begin creating your Data Flow Diagram.
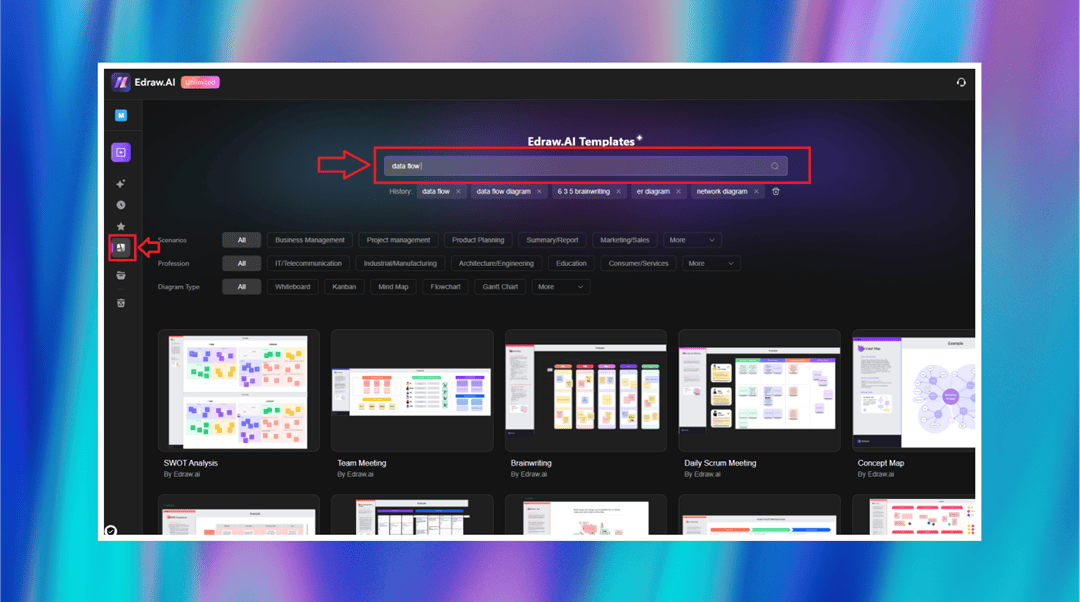
Step 2Search a Perfect Template
Once you sign in, go to the search box in the templates community. Then, type "data flow diagram." Pick one suitable template from the list and click "create with template" to get the same opened in the editor for customization.
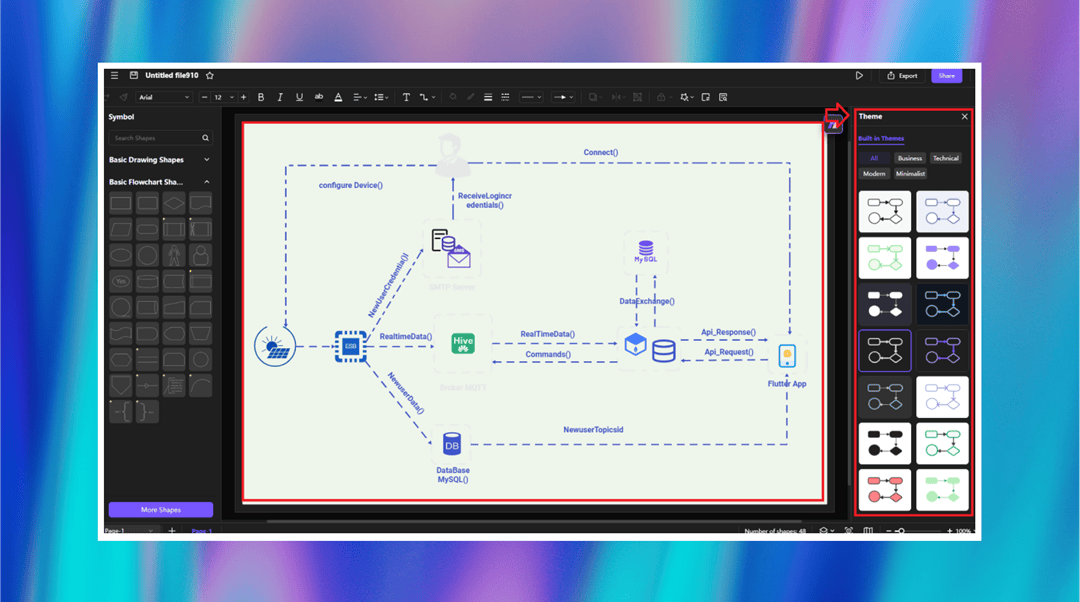
Step 3Customize the Diagram
Click the Theme button on the right-hand side to enhance the appearance of your diagram. You have various themes available, such as business, technical, modern, and minimalist styles. Applying a theme makes all the elements look uniform and more readable. This makes your Data Flow Diagram appear more organized and professional.
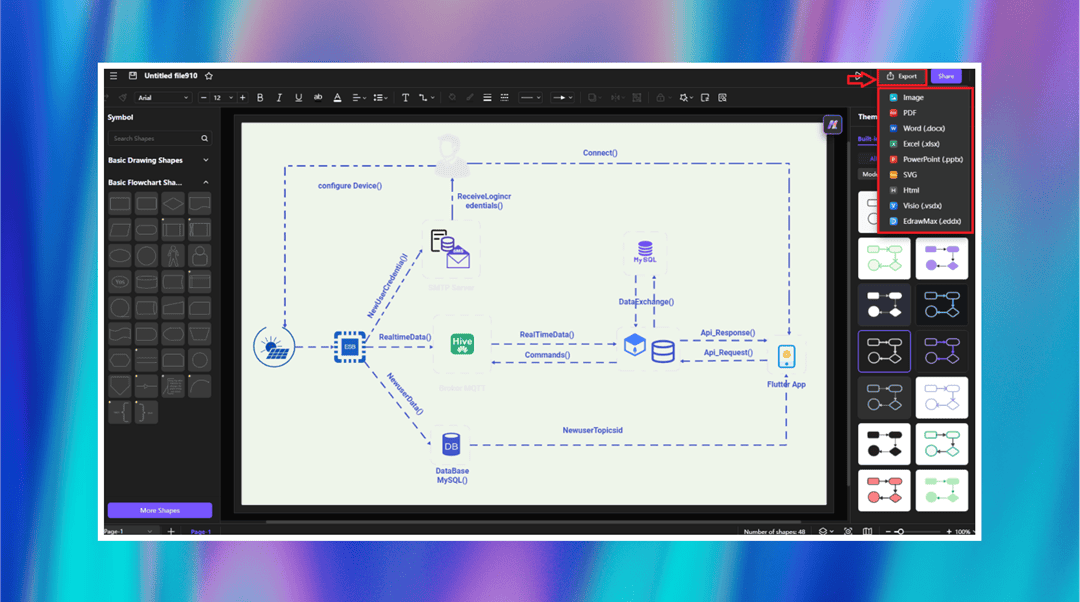
Step 4Export Your Diagram
Hit the Export button at the top right to export your Data Flow Diagram. You can choose from several formats like PDF, PNG, Word, Excel, PowerPoint, SVG, or Visio. This lets you present your diagram in a format that is suitable for presentations, reports, or for editing later.
Conclusion
Data Flow Diagrams (DFDs) visually explain data streams that occur in a system. Their primary role is to present information about how an organization or system processes data.
DFDs also help users understand their sources and storage locations. They utilize standardized symbols to assist users, and you can customize the DFD according to your needs. DFDs help users understand system operations and spot processing weaknesses as they seek data management improvements.