
Data Flow Diagrams help you figure out how data flows through a system. Why is it important? It simplifies system structure and interaction. A data flow diagram helps visualize these processes.
Whether designing a new system or analyzing an existing one, DFDs help identify the flow of information. There are so many tools available to create data flow diagrams.
However, most of these tools fail when catering to professional-level requirements. In that case, you can use Edraw.AI. This is why we have made a simple guide on making a data flow diagram in Edraw.AI.
In this article
What Are Data Flow Diagrams (DFDs)?
A data flow diagram outlines how information flows within a system and how it is transformed within a system. Besides, it provides a better understanding of how data is handled using a structure. It is possible to create a data flow diagram using some symbols. It includes:
- Processes: A rectangular shape with rounded edges illustrates a process. It displays the actions taken on the data.
- Data Flows: Arrows indicate the movement of data between components.
- Data Stores: Open-ended rectangles that depict where data is stored.
- External Entities: Rectangles representing external users, systems, or organizations interacting with the system.
How To Create Data Flow Diagrams?
Two common methods exist to create DFDs: manually from scratch or using templates. We will explain both to help you understand:
Method 1: Creating DFDs from Scratch
Identify System Components: First, specify external entities, individual processes, information stores, and information streams within the workflow or system.
Define Boundaries: After that, use parameters to include and exclude users from the system.
Use Standard Symbols: You have to use the necessary DFD symbols to create your desired data flow diagram.
Map the Dataflow: Now, connect entities, processes, and storage points using arrows to depict the direction of data movement. Finally, make the necessary adjustments to create the diagram.
Method 2: Creating DFDs Using Templates
You can use the DFD template to create your data flow diagram. Templates save time because users do not have to create a new diagram. Templates allow users to focus on the detailed logical flow rather than wasting time setting shapes and connectors.
Benefits of DFD Templates
- You don't need much knowledge to make a DFD.
- Users can instantly make adjustments and create a DFD.
- Standardized symbols and layouts prevent common errors in diagram creation.
- You can easily modify the template and make the necessary changes.
- Well-structured templates enhance clarity and communication.
How to Make a DFD Using a Template?
- Search for Templates: First, search for the relevant DFD template. You can use different online diagram makers to find one.
- Customize the Template: Change the entities, data streams, and processes to suit the system requirements.
- Review and Validate: Before finalizing the document, you need to ensure the DFD perfectly captures the system.
- Export: Save the diagram in your desired format and send it to the concerned stakeholders.
How to Make a Data Flow Diagram For Free
Using manual methods can be difficult if you are unfamiliar with creating a DFD. In that case, you should use Edraw.AI to create DFDs. It is an advanced tool that offers free AI features to create diagrams. Besides, the tool provides several diagrams.
Step 1Open Edraw.AI
In the first step, log in to Edraw.AI and navigate to the data flow diagram section. You can pick a template to save time or start with a blank canvas for full customization
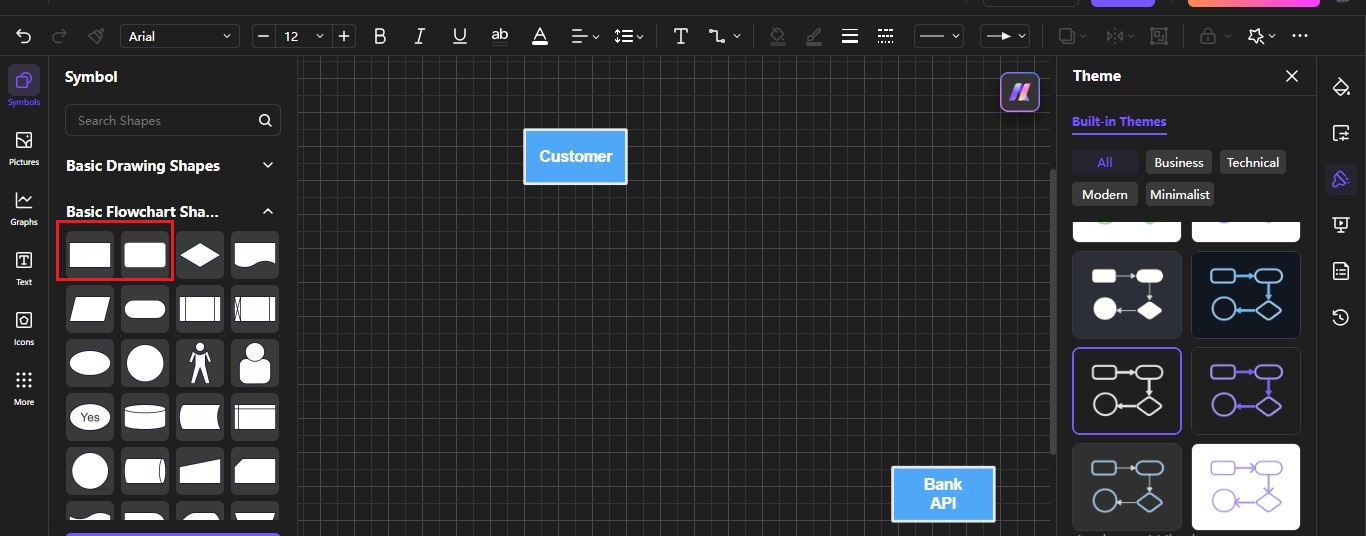
Step 2Add External Entities
External entities represent users, systems, or third-party services interacting with your process. In Edraw.AI, you can drag and drop rectangle shapes onto the canvas to create these entities. Make sure to label them appropriately to define their roles in data exchange. Edraw.AI lets you change colors and text styles. This helps make your diagram look good and easy to read.
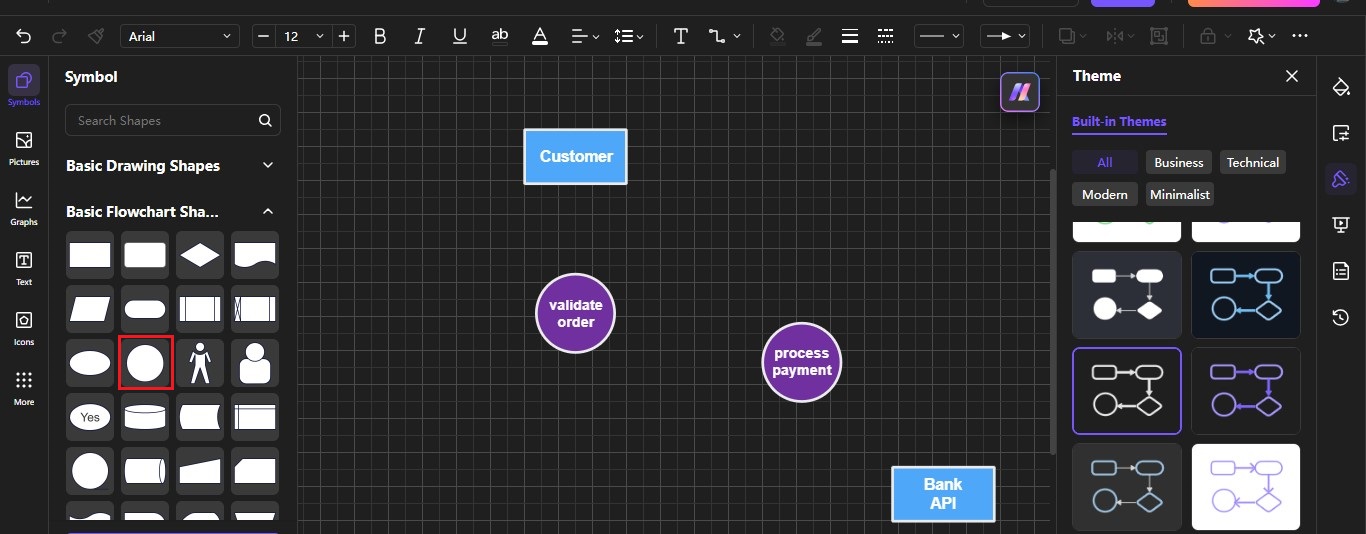
Step 3Insert Processes
Processes define how data is transformed within the system. In Edraw.AI, you can insert rounded shapes to represent processes. Double-click the shape to rename it. You can also change its look using the styling tools.
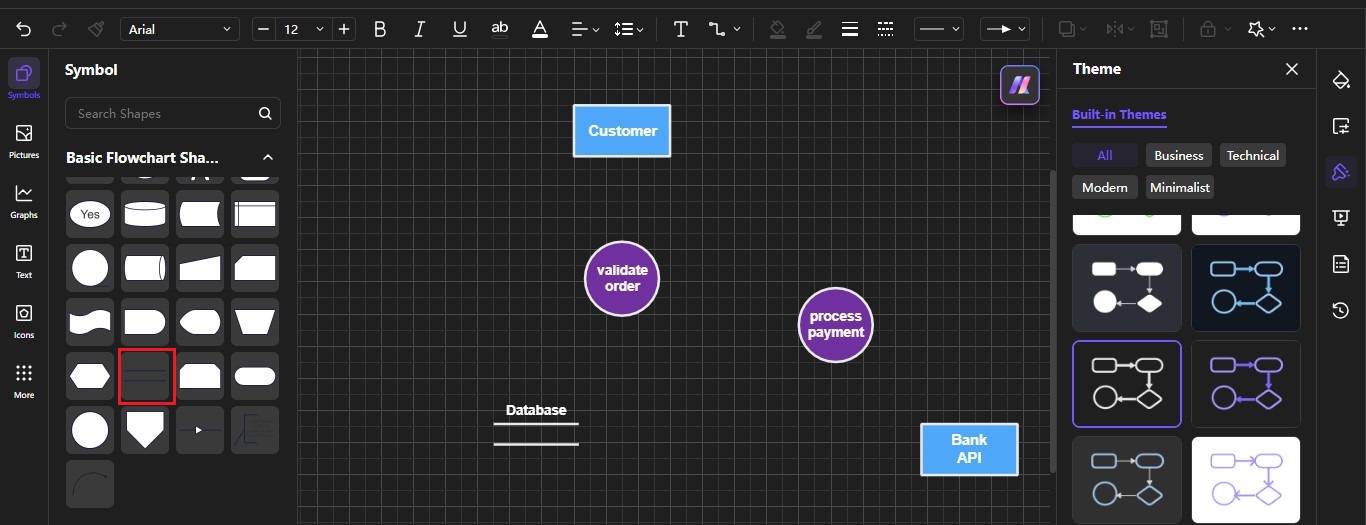
Step 4Include Data Stores
A data store is where information is held for future use. In Edraw.AI, data stores are represented as parallel lines or open-ended rectangles. Here, AI-assisted linking lets you connect data stores to processes easily. This ensures a smooth flow of information.
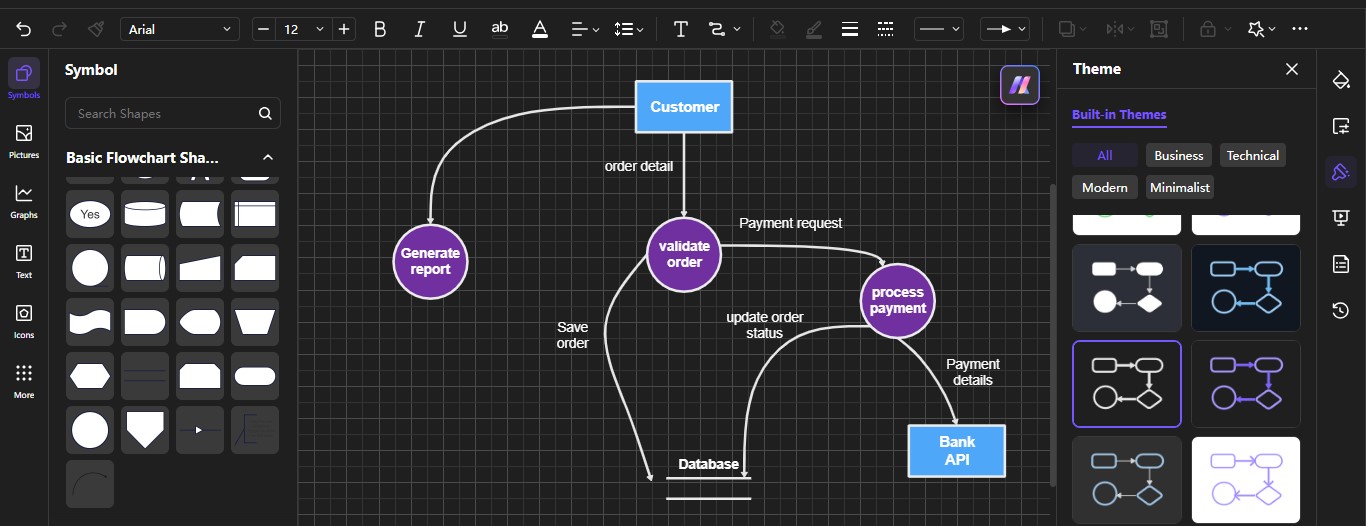
Step 5Connect Elements with Data Flows
Data flows show how information moves between outside entities, processes, and data stores. In Edraw.AI, you can draw arrows to indicate the direction of data movement, ensuring each connection is clear. Just click on an entity, process, or data store. Then, use the automatic connector tool to create relationships. Each arrow should be labeled with the type of data being transferred.
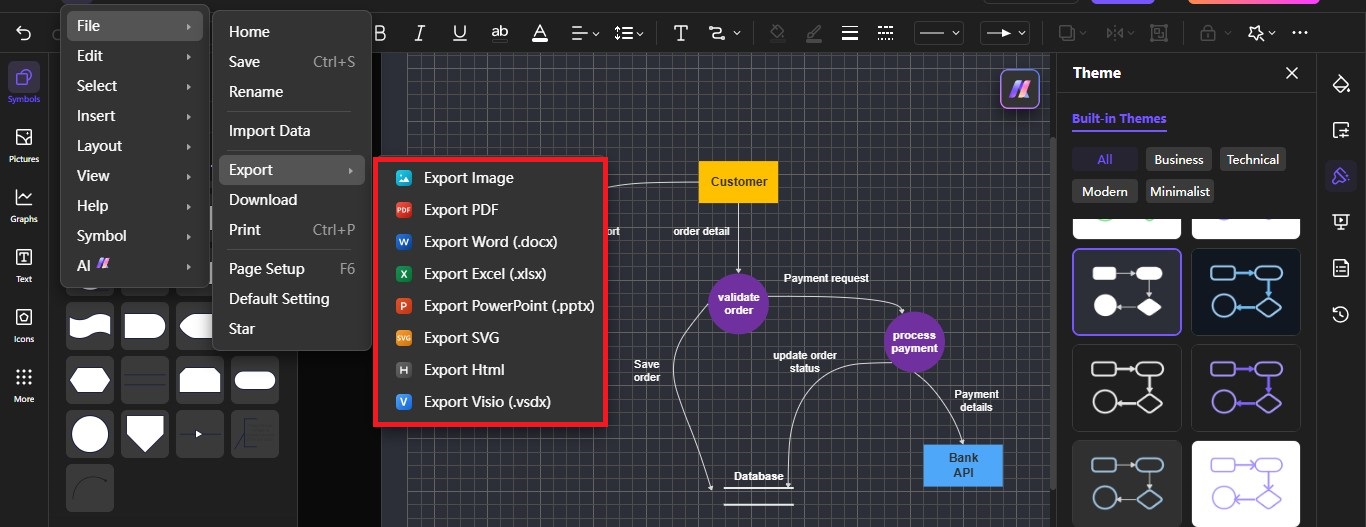
Step 6Review, Customize, and Export
After you complete your DFD, review it for accuracy. Use Edraw.AI to spot data flow issues. Adjust the elements to fix any problems. Use the customization tools to refine the design. Change colors, fonts, and line styles to meet your documentation standards. When ready, export your diagram in various formats. Here you can choose from various options like PNG, PDF, or SVG.
Advanced Tips for Creating Effective DFDs
If you want to make an appropriate DFD diagram, you need to consider a few factors. Here are some advanced tips to improve your DFDs.
- If you are making a diagram of a complex system, start with a context-level diagram. Then, break it down into more detailed levels. This will provide more clarity to the system.
- Ensure data stores, processes, and entities are labeled DFD consistently at all levels. This will help avoid confusion while completing the diagram.
- You must use standard notations such as circles for processes, rectangles for external entities, and data stores as parallel lines.
- Remove unnecessary data flows and unnecessary data storage for better processes.
- Organize flows to be read without congestion, cross-overs, and needless complications.
- Every process should lose meaning or functionality if your data flow diagram is divided into sub-processes.
- Clearly define processes, data stores, and flows with descriptive names to improve understanding.
- Test your DFD against actual workflows to ensure accuracy
- Seek feedback for improvements and make necessary changes
Conclusion
I hope you have a complete idea of the data flow diagram. You can make manual diagrams or use an effective tool to create professional diagrams.
Beginners often find creating a manual Data Flow Diagram (DFD) challenging. You need to understand the symbols, their meanings, and the correct way to represent data flow. Additionally, choosing the right tool to create a DFD can be confusing.
So, if you don’t know how to make a DFD, it’s best to use an online DFD maker. You should use tools like Edraw.AI to meet your needs. The tool has advanced AI features and premade diagram templates to make more efficient data flow diagrams.