
Databases organize entity information into structured formats, with Entity-Relationship Diagrams (ERDs) being the most common type. ERDs are essential in database design, clearly showing how entities—like people, objects, or concepts—connect.
In this article
If you’re new to making ER diagrams, this guide is for you. We’ll explain how to create them from scratch, starting with the basics: what an ER diagram is and how its symbols (entities, relationships, and attributes) work.
You can use various tools to build ERDs, even without internet access. For added ease, online ER diagram makers simplify the process. We’ve included Edraw.AI, a top online tool for UML and ER diagrams, as an example.
You can quickly design professional ER diagrams with the right tools and know-how. Let’s explore how to build, analyze, and maintain them effectively. But first, in case you are new to this area, what exactly is an ER diagram?
What Is an ER Diagram?
ERD stands for Entity-Relationship Diagram. It’s a visual tool that shows how entities—like people, objects, or ideas—relate in a system. Commonly used in software development and database management, ERDs help design organized, reliable databases by mapping connections between items. They’re somewhat like flowcharts but focus on data relationships.
To make an ER diagram, start by listing all entities, defining their relationships, and adding details like attributes. Many online tools make this process simple and efficient.
How to Make an ER Diagram?
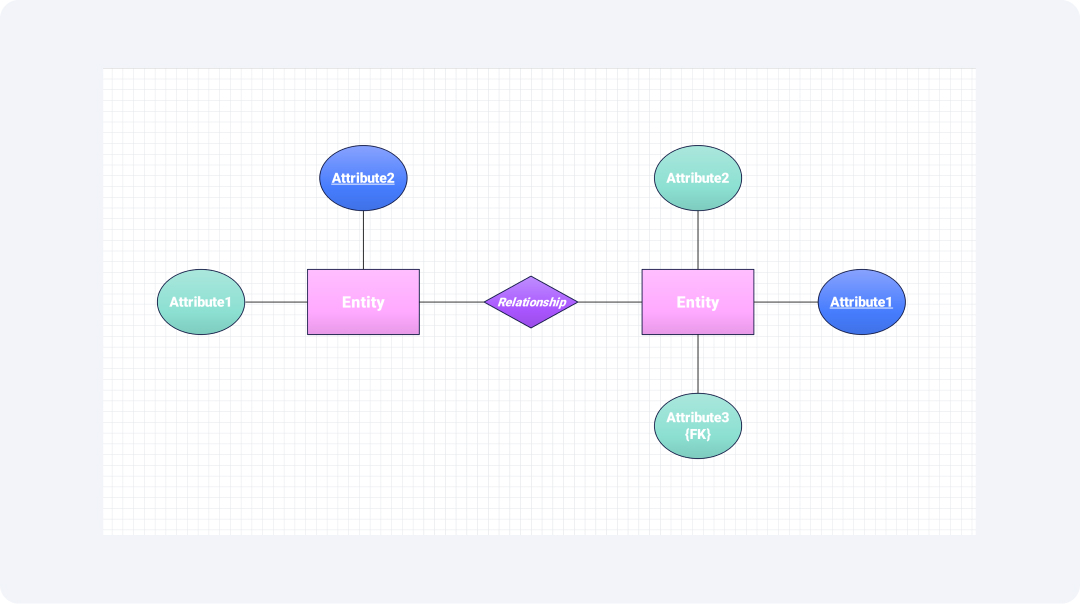
Making an ER diagram is straightforward, especially with an online ER diagram maker. Entities are shown as rectangular boxes, attributes as ovals, and relationships as arrow lines connecting them.
Relationships can vary: one-to-one, one-to-many, or many-to-many, and they can be mandatory or optional. Most tools simplify this with drag-and-drop features, ready-made templates, and auto-alignment.
Some platforms also offer real-time collaboration for team projects. Here’s how to create an ER diagram using these tools.
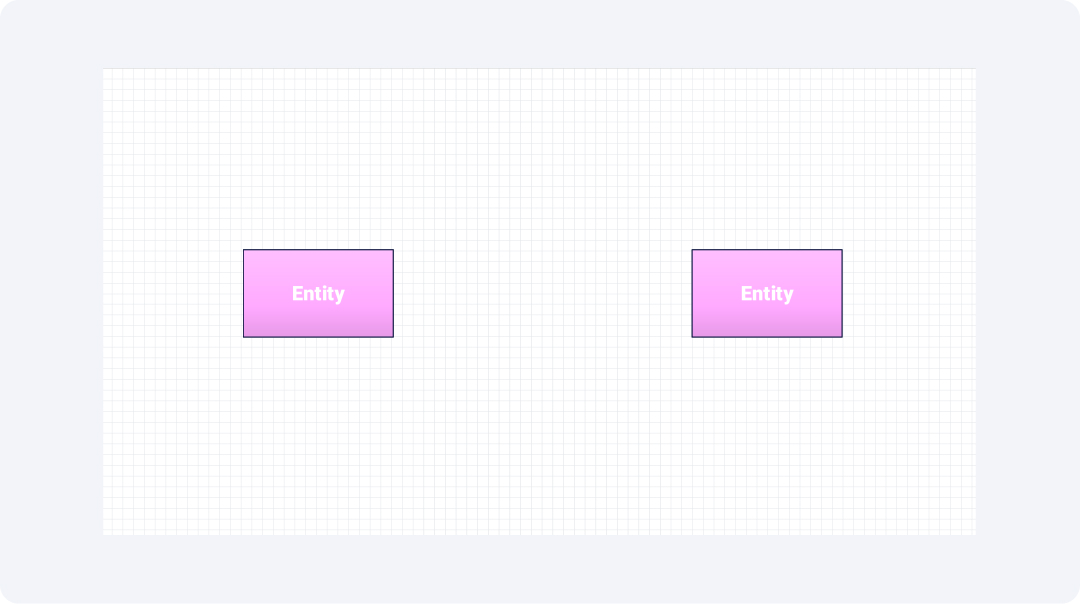
Step 1Identify the Entities
An ER diagram consists of entities that serve as its fundamental building blocks by representing the system's items, individuals, and locations or abstract concepts. Within an ER diagram, an entity is defined using a rectangular shape that contains the corresponding name of the entity.
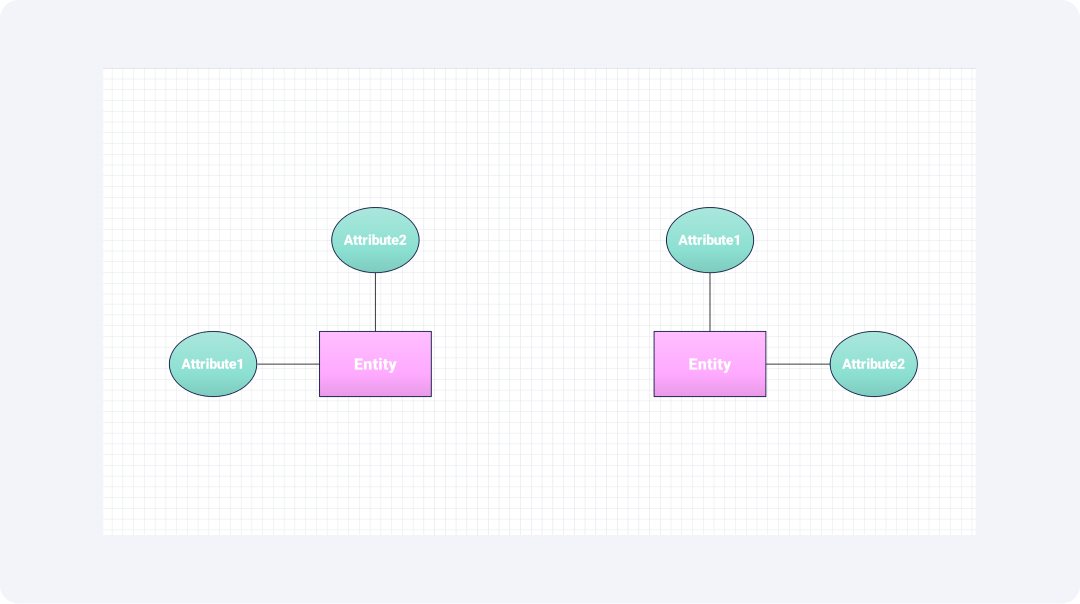
Step 2Identify the Attributes
An entity of a system has different attributes that explain its characteristics. Here, oval shapes are used to represent attributes that point to their corresponding entity. General information attributes such as names or descriptions exist next to unique identifiers like ID’s, which serve as distinct identifiers for each entity instance.
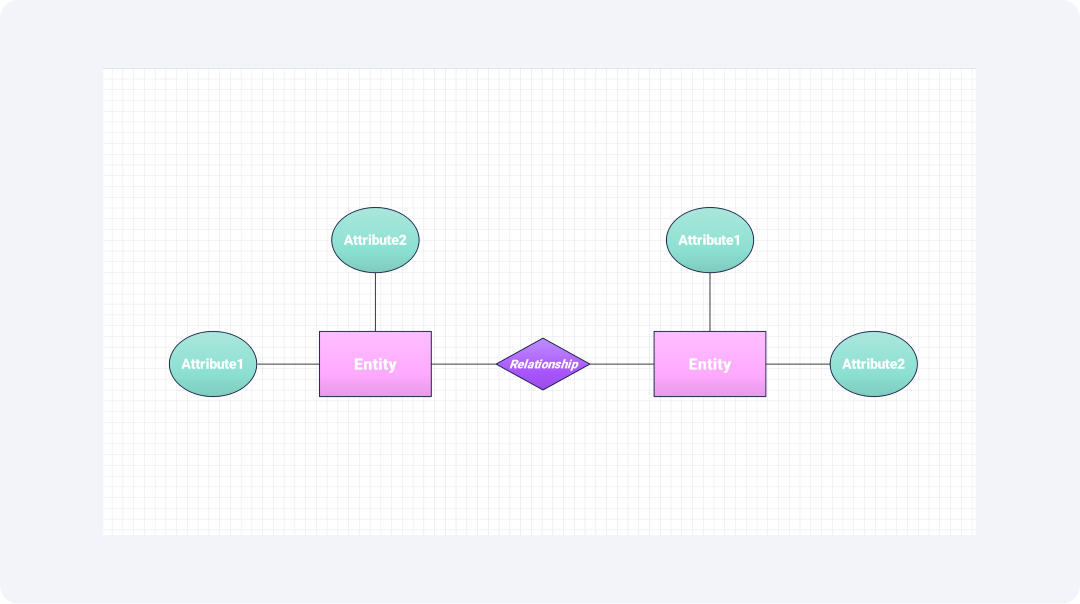
Step 3Determine the Relationship
Entities function independently but they can sometimes connect with other entities. A diamond shape is used to represent the relationship between different entities. A relationship can be of many types. It can be one-to-one, one-to-many, and many-to-many.
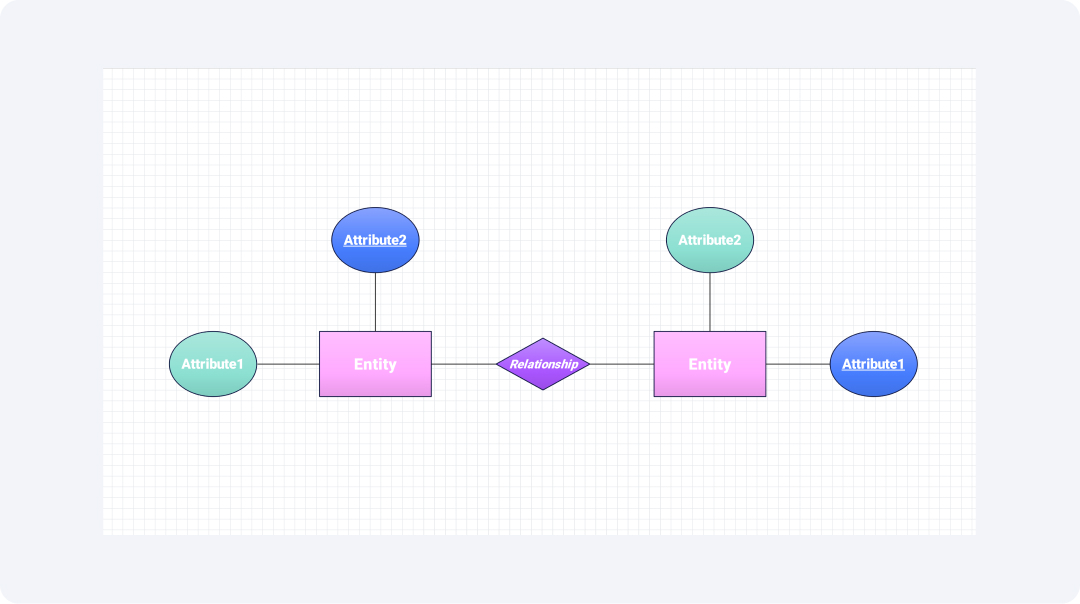
Step 4Assign Primary Key
Each entity requires a unique identification key known as the primary key. The primary key prevents duplicate records from existing in the database. Primary keys in ER diagrams is generally represented by underlined text inside the entity box.
Step 5Establish Foreign Key References
Foreign keys serve as references to link entities that share some type of relationship between them. If two entities are related, one will have a foreign key that refers to the primary key of another entity. The keyword {FK} written within parenthesis represents a foreign key.
Step 6Review the Diagram
The final step is to review the diagram created. Here, check whether the diagram contains all entities and attributes in their correct positions. Are the relationships properly defined? The process of refining your diagram will then lead to an exact representation of the system which can then later be implemented.
Make an ER Diagram Now for Free!
Many online Entity-Relationship (ER) diagram makers fall short, offering limited features that hinder designing, analyzing, and optimizing database relationships. Luckily, Edraw.AI delivers a free, user-friendly platform to create professional ER diagrams in minutes.
What is Edraw.AI?
Edraw.AI is an online tool that simplifies making ER diagrams, flowcharts, and org charts. With its easy drag-and-drop interface and a wide range of pre-built templates, anyone can craft polished diagrams—no design skills needed.
Being web-based, it lets you access and edit your work from anywhere, no installation required. Here’s how to create an ER diagram using Edraw.AI’s templates.
How to Make an ER Diagram on Edraw.AI?
Step 1Choose a template
Visit the official website of Edraw.AI. Go to the Template section on the homepage. You can also search for “ER Diagram” using the search bar. Browse the samples and choose one. After that, click on “Create with Template”

Step 2Edit and customize
Once in the editing screen, enter your data by double-clicking on the appropriate location. Use the left-hand panel to add symbols, icons, and photos. On the right-hand side, adjust page settings and themes.
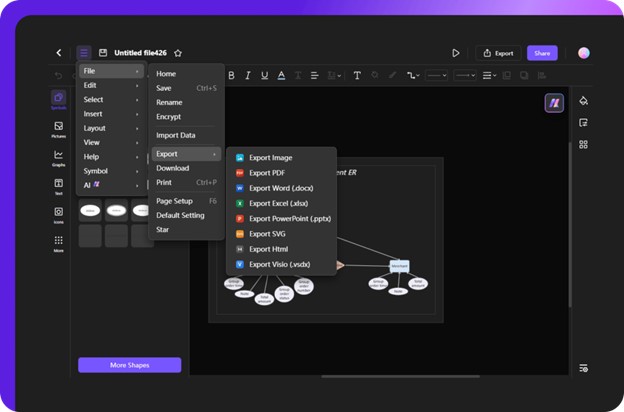
Step 3Export your ER diagram!
Once finished, click the Export button in the quick-access toolbar to download it in your selected format (PDF, PNG, or SVG). Do you need to collaborate? Use the Share button at the top-right corner to instantly submit it to your team and begin working together in real time.

Ending Notes
ER diagrams are like flowcharts that show how entities connect in a system. They’re especially tied to databases, making it easier to visualize and understand stored data.
These diagrams help database designers, developers, and stakeholders communicate clearly, providing a guide for discussing database structure. ERDs highlight entity relationships, reducing data duplication, boosting integrity, and supporting efficient normalization.
In this guide, we’ve covered ER diagrams in detail and explained how to create them using Edraw.AI, a leading online UML and ER diagram tool. Plus, its pre-built templates can save you time.