
A Data Flow Diagram (DFD) visually represents how data moves through an information system. It uses standardized symbols to depict data flow, processes, storage, and external interactions, making it easier to analyze and design systems. This approach helps developers and businesses streamline their work by offering a clear understanding of the system’s operation.
In this guide, we’ll walk you through the key DFD symbols and their uses, so you can create effective diagrams. Whether you're new to DFDs or just looking for a refresher, this explanation will simplify things.
In this article
What Is a Data Flow Diagram?
A DFD is a visual tool that illustrates how data flows through a system, highlighting inputs, processes, storage, and outputs. By breaking down complex systems into clear visuals, DFDs make it easier to analyze, improve, and design more efficient systems. There are two main types of DFDs: conceptual and physical, which we'll explore in more detail later.
Common Types of Data Flow Diagram Symbols And Meanings
| Symbol Name | Description | Example |
| External Entity Symbol | Rectangle |
 |
| Process Symbol | Circle |
 |
| Data Store Symbol | Two parallel lines |
 |
| Data Flow Symbol | Directional lines |
 |
Here’s a complete description of each symbol.
External Entity Symbol
The external entity symbol, which is drawn as a square or rectangle, shows outside elements like users or external databases.
Process Symbol
The process symbol represents functions that turn inputs into outputs. It’s a circle or box labeled with its operation name that tracks how data moves.
Data Store Symbol
The data store symbol marks where data is kept for later use. It’s an open-ended rectangle showing accessible storage for processes.
Data Flow Symbol
The data flow symbol indicates data movement between entities, processes, and stores. It’s an arrow pointing in the direction of flow, linking system parts.
Conceptual Data Flow Diagram Symbols
Conceptual DFDs offer a simple, high-level view of a system without technical details. Key symbols include:
- General Process Symbols: Show main activities.
- Data Flow Symbols: Trace internal data paths.
- Data Store Symbols: Mark storage locations.
- External Entities: Represent inputs and outputs.
Physical Data Flow Diagram Symbols
Physical DFDs detail the system’s structure with technical depth. Key symbols include:
- Detailed Process Symbols: Show specific functions.
- Database Symbols: Represent structured storage.
- System Component Symbols: Display processors and hardware.
- Data Flow Connectors: Link system elements.
Explore More Data Flow Diagram Symbols on Edraw.AI
We’ve covered the basic DFD symbols, but there’s more to discover. Edraw.AI offers a library of over 26,000 symbols, perfect for building detailed data flow diagrams.
It includes symbols for entities, processes, data stores, and data flows, with a drag-and-drop feature to add them easily. You can use pre-made templates or start from scratch. The intuitive interface and collaboration tools help you create precise, professional DFDs quickly.
What Is Edraw.AI?
Edraw.AI is a powerful diagramming tool for creating professional diagrams, presentations, and more.
With pre-built templates, vector symbols, and customization options, it’s user-friendly and versatile. Key features include:
- Templates for various diagram types
- Ready-to-use symbols
- Easy diagram creation and editing
- Secure online file access
- Built-in screenshot tool
- Watermark editing for branding
- Multi-platform support
- Team sharing and editing
- Export in multiple formats
How to Find More Data Flow Diagram Symbols on Edraw.AI?
Edraw.AI makes it simple to find symbols for your DFDs. Follow these steps:
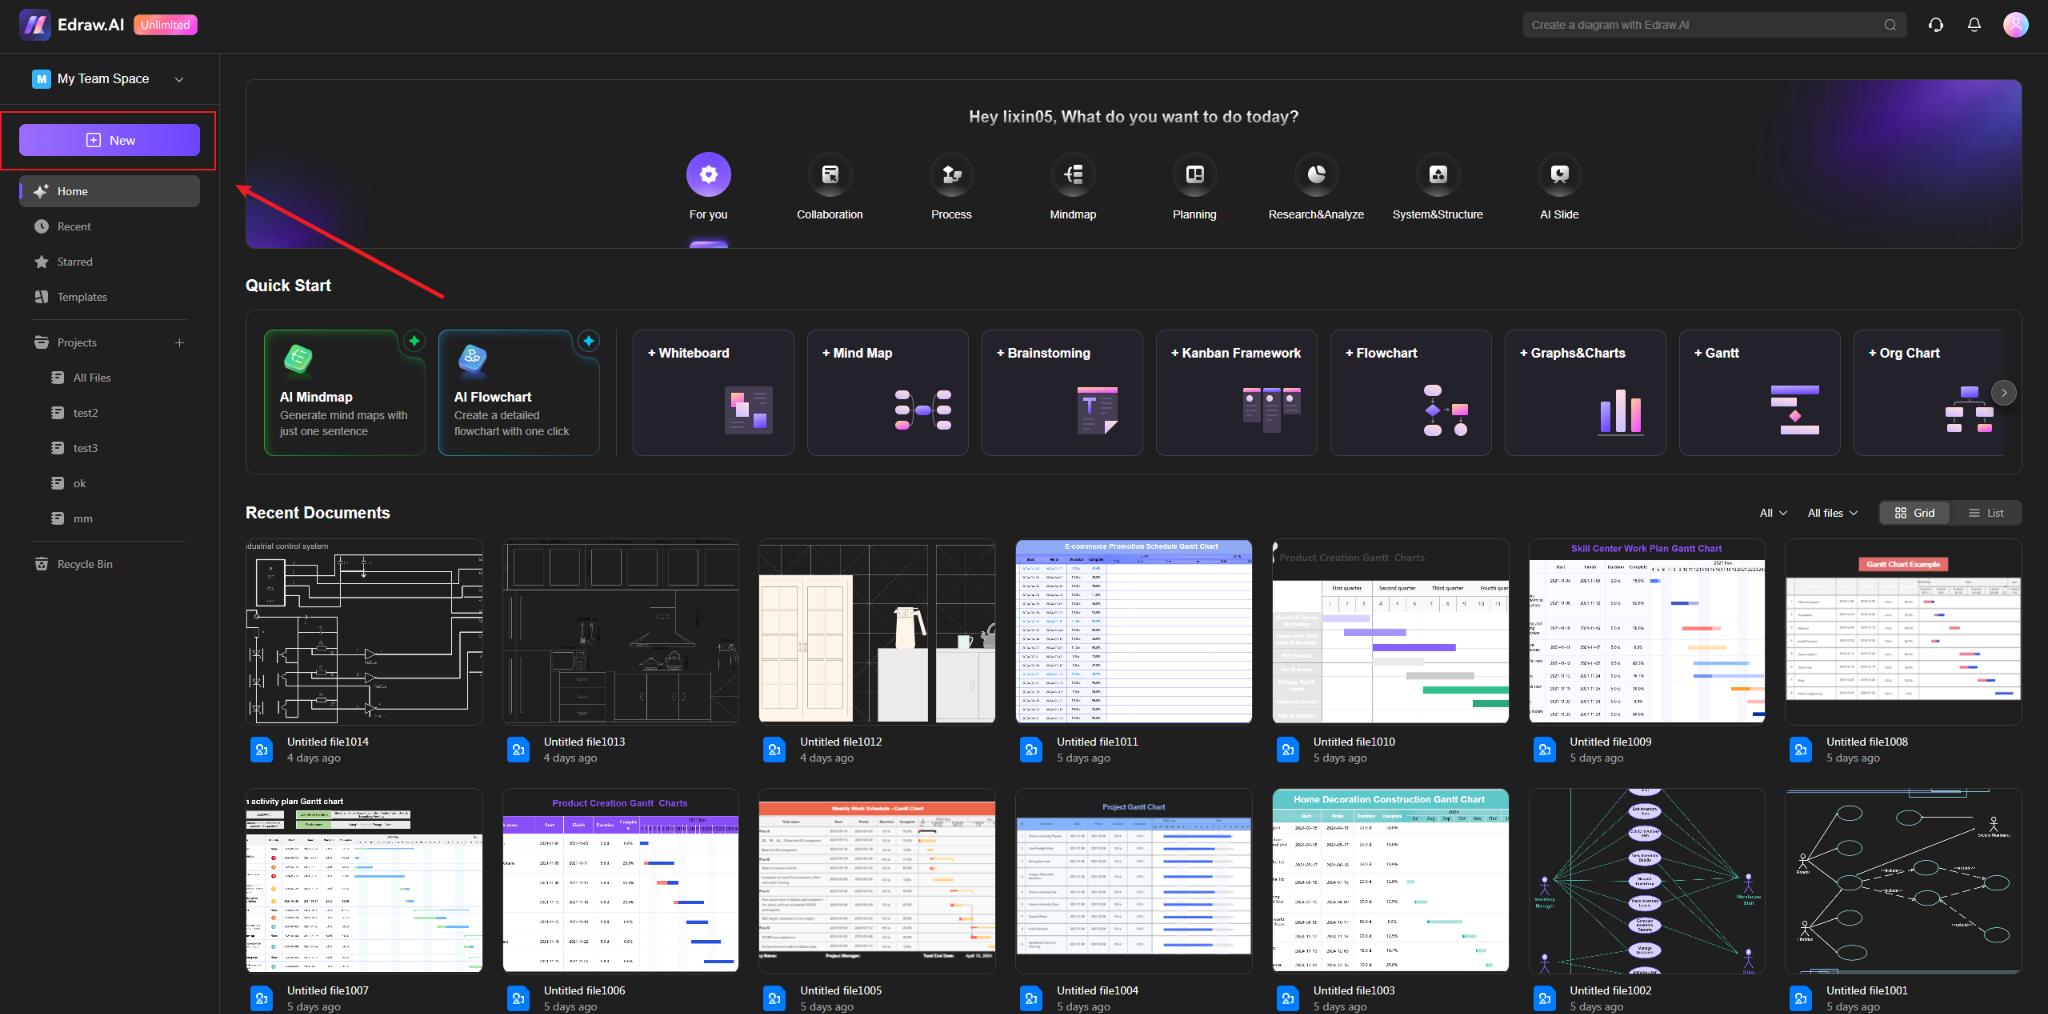
Step 1Open Edraw.AI
Open Edraw.AI and click New.
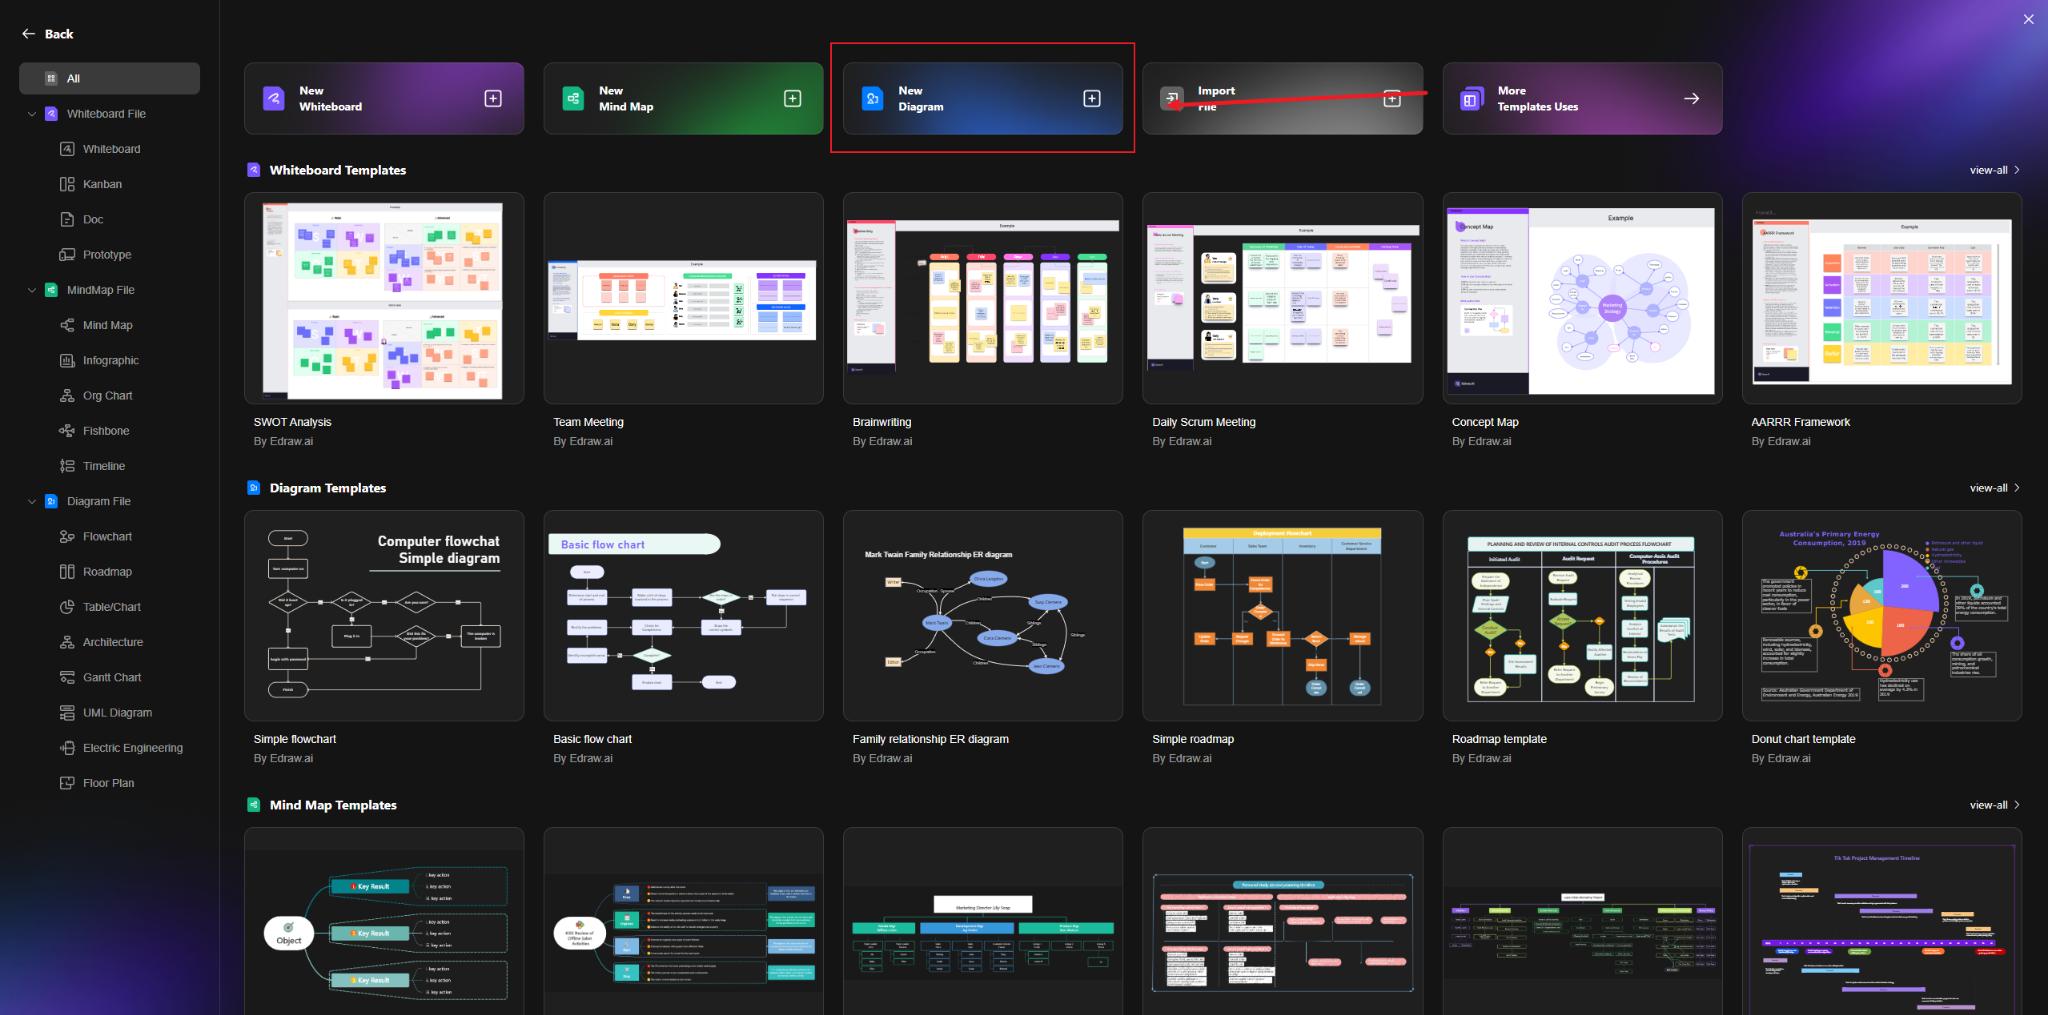
Step 2Open Diagram Editor
Click New Diagram to open the diagram editor of edraw.ai.
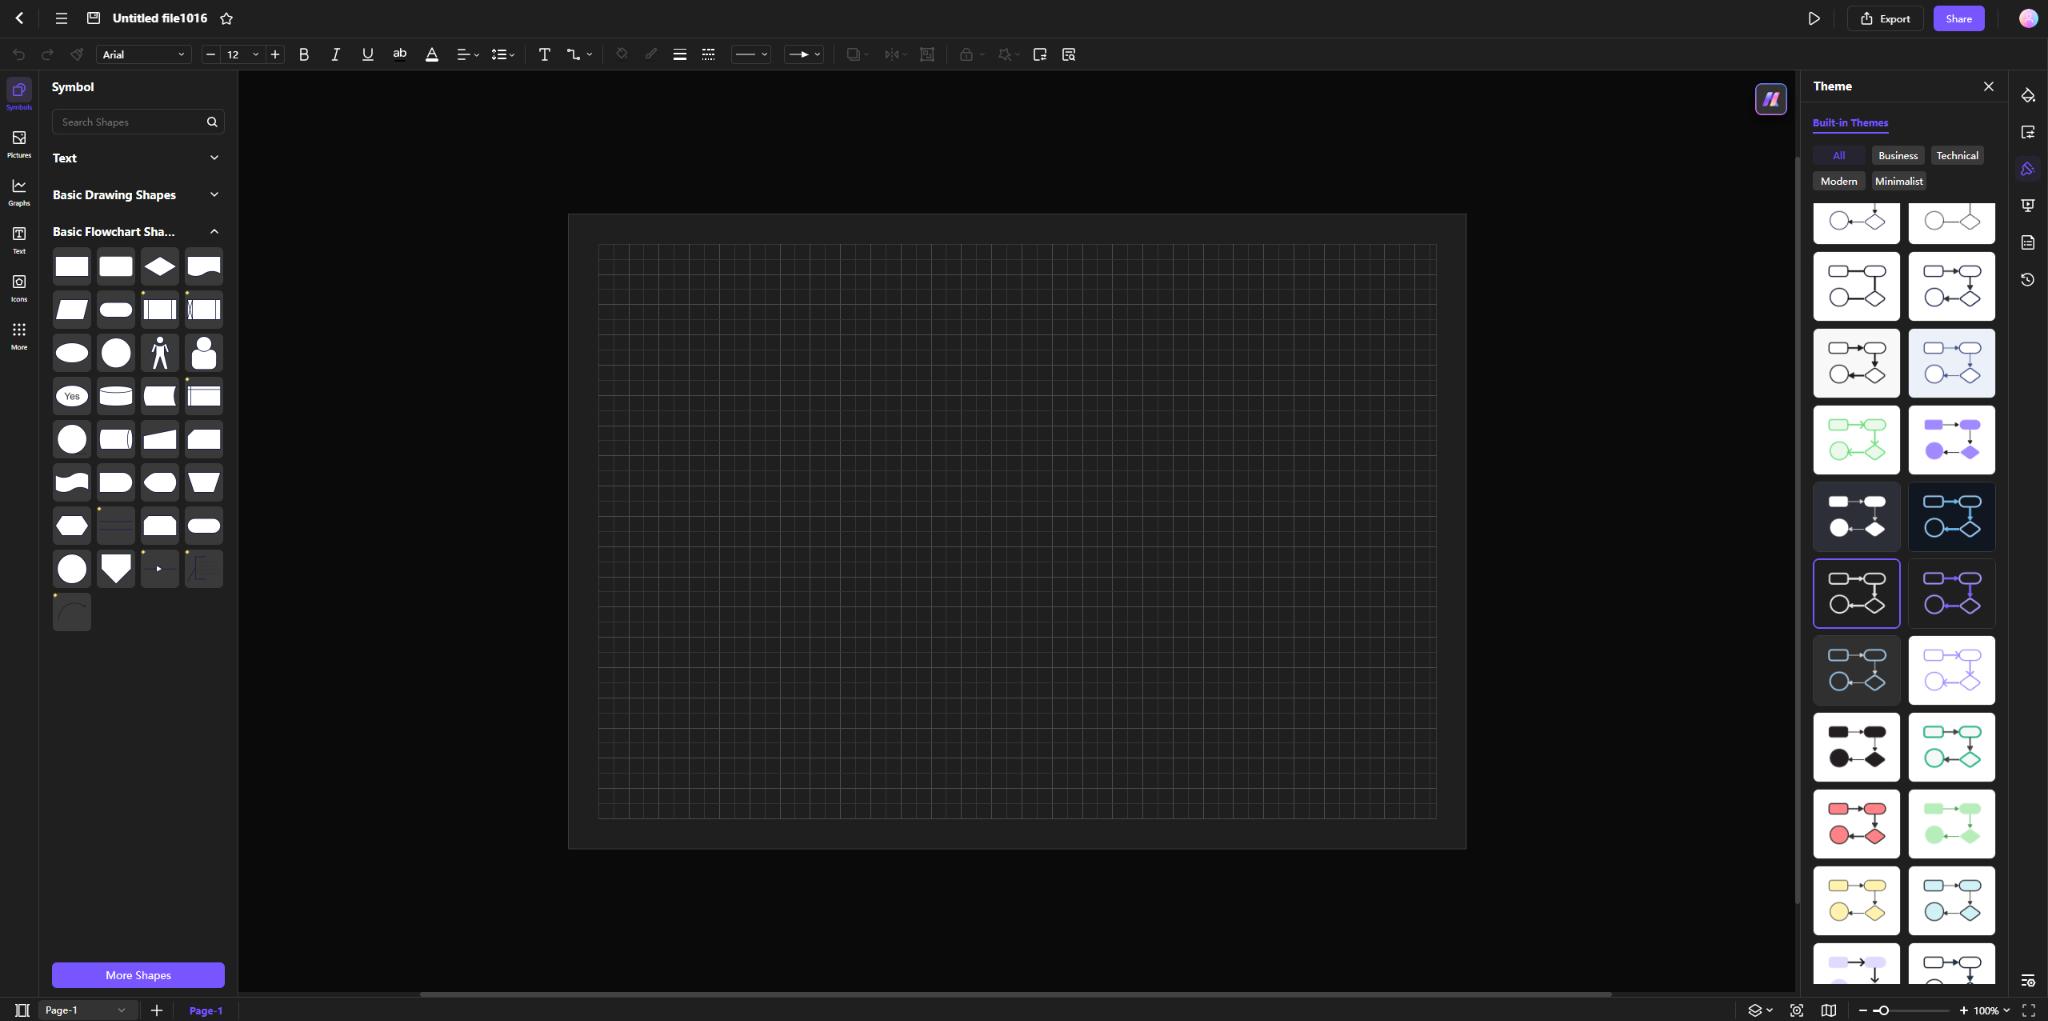
Step 3 Access Symbol Library
Open Edraw.AI, go to the drawing page, select Flowchart, and choose New Blank Flowchart. Find the Symbols panel on the left side.
To find symbols:
- Click the Symbols to open the library window.
- Browse through the available symbols. Select the desired ones, and click to find the different symbols.
Step 4Insert Symbols into the Drawing Page
After adding the Symbol Library pane, drag and drop the symbol onto the canvas. Adjust the size, position, or style of the symbol as needed.
How to Make a Data Flow Diagram on Edraw.AI?
Edraw.AI is a user-friendly tool for creating Data Flow Diagrams (DFDs) online. Follow these simple steps to create a DFD:
Step 1Login to your account
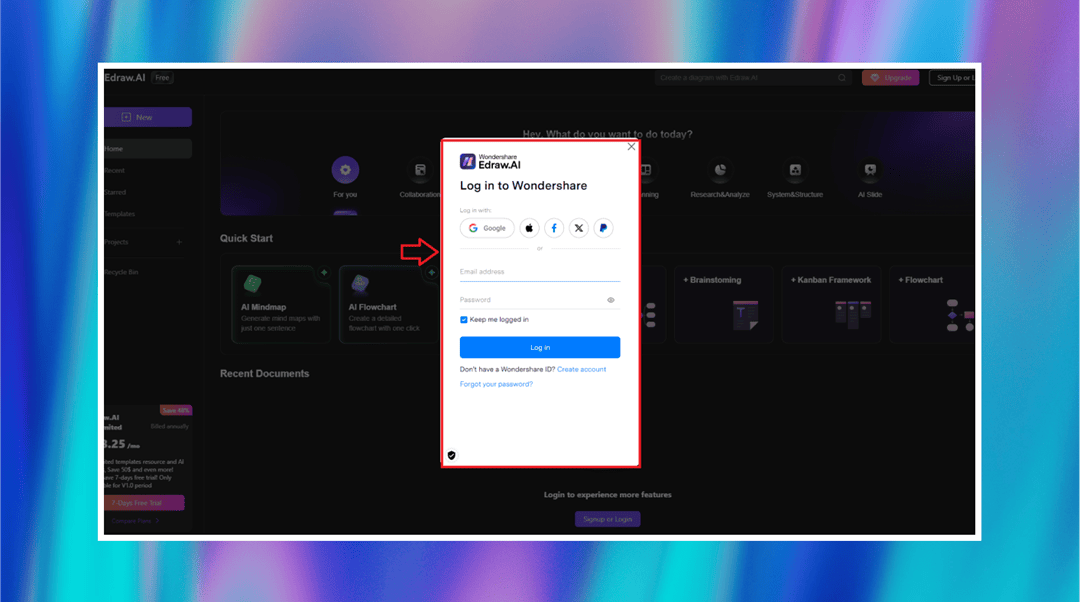
Enter your Wondershare username and password in the login window. If you are not registered, sign up with Google, Apple, Facebook, or PayPal. Alternatively, you can click on Create account to create a new account. This will allow you to access your diagram securely.
Step 2Flow Diagram From Scratch
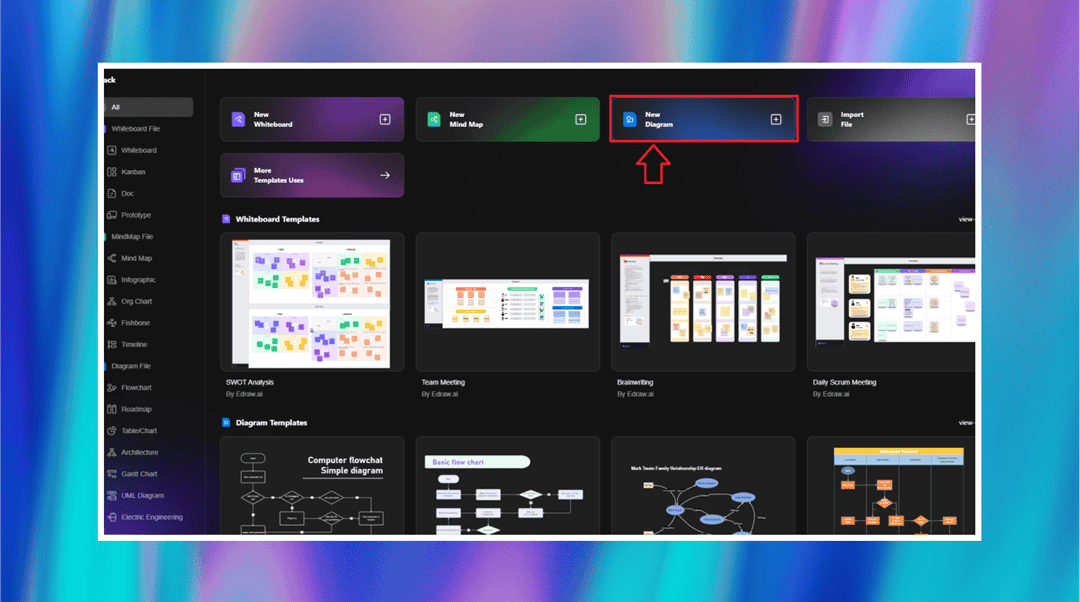
Click the New button. Choose New Diagram from the list of options to open an empty space. This action gives you a flexible environment where you can start creating your Data Flow Diagram with ready-made symbols and objects.
Step 3Choose the Symbols
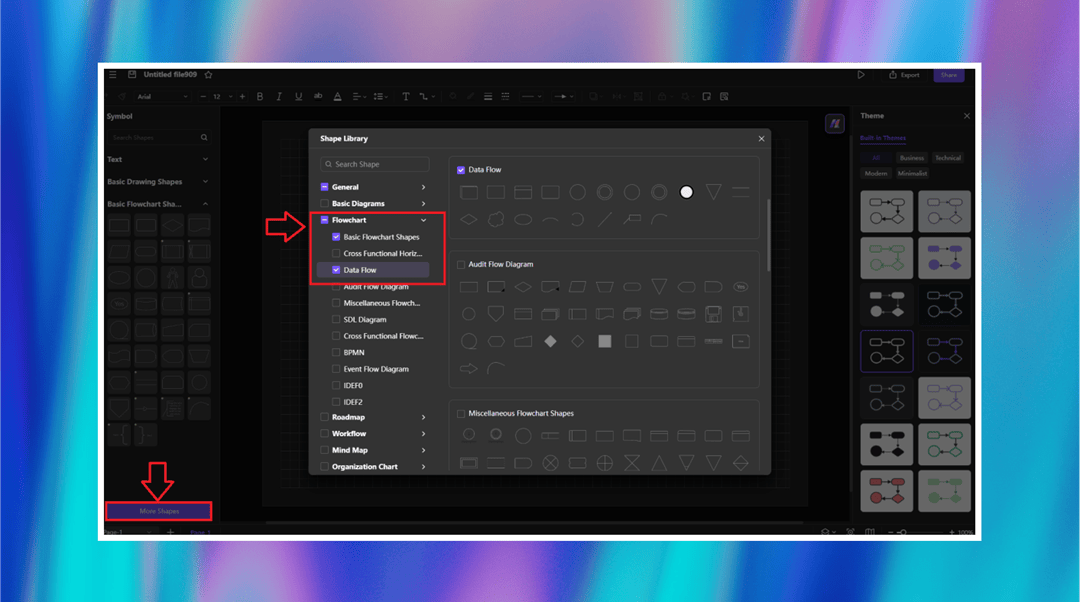
Click on the More Shapes button at the bottom left. Within the Shape Library, expand the Flowchart category and click on Data Flow to see the symbols you will use. These shapes represent processes, data stores, and entities in your diagram, and you can use them to visualize data flow.
Step 4Customize Your Diagram
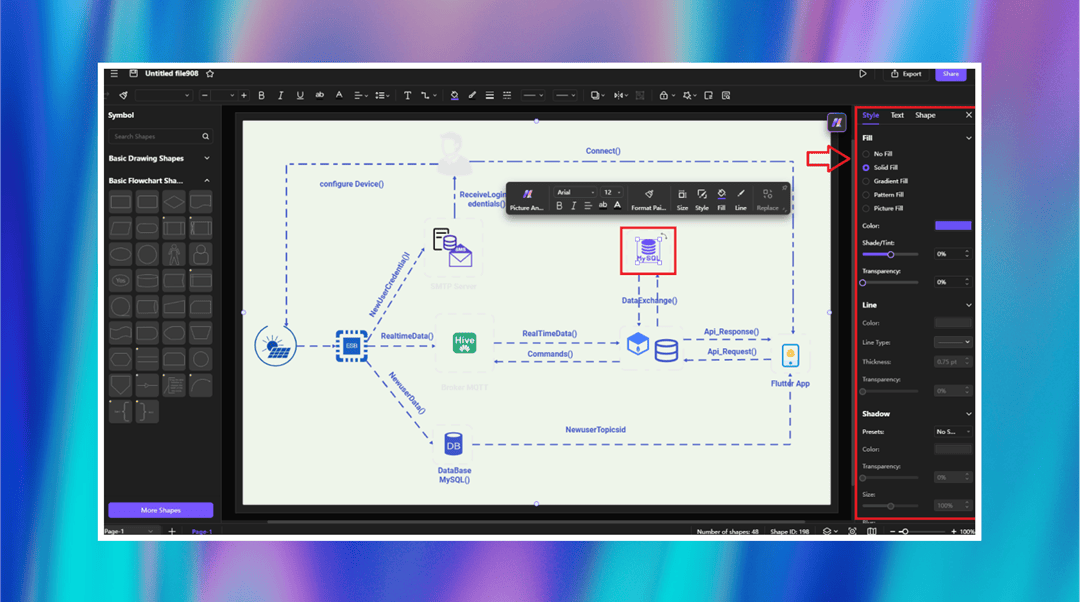
Pick any symbol in the diagram to modify its properties. Utilize the toolbar to change text, colors, line styles, and shapes. The Style panel on the right provides further options for customization, allowing you to refine the look and make your Data Flow Diagram more comprehensible.
Step 5Share Your Diagram
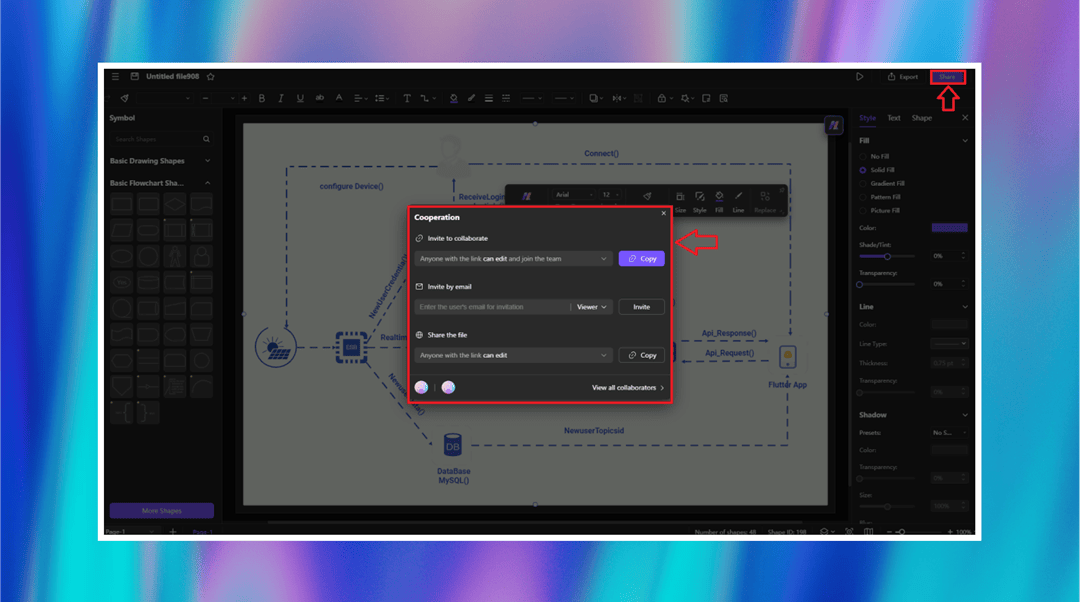
Click the Share button at the top right to collaborate. Invite team members by sending them an email or create a link for easy access. Select editing permissions as needed to enable collaboration on your Data Flow Diagram.
Ending Notes
Creating Data Flow Diagrams isn’t hard. Once you understand the symbols and their roles, Edraw.AI lets you build professional DFDs quickly and easily. With its simple interface, huge symbol library, and flexible templates, it’s a great choice for custom diagrams.
Ready to start? Check out Edraw.AI Online and visualize your data flow effortlessly. It streamlines diagramming and turns your ideas into clear visuals!