
Traditional tools make graph creation needlessly complicated. Formatting is clunky, styles rarely match, and one small mistake can break the entire layout.
In this article
And if you have complex data, it only adds to the salt.
Therefore, as an expert tool tester, I've tried multiple tools, and Edraw.AI is the most intuitive tool so far.
In this write-up, I will walk you through how to make a graph on Edraw.AI with just a few clicks.
How to Create a Graph in Edraw.AI?
You only need a simple text description—Edraw.AI does the rest. No manual work, no extra effort. If you need a graph quickly, this is the most efficient way.
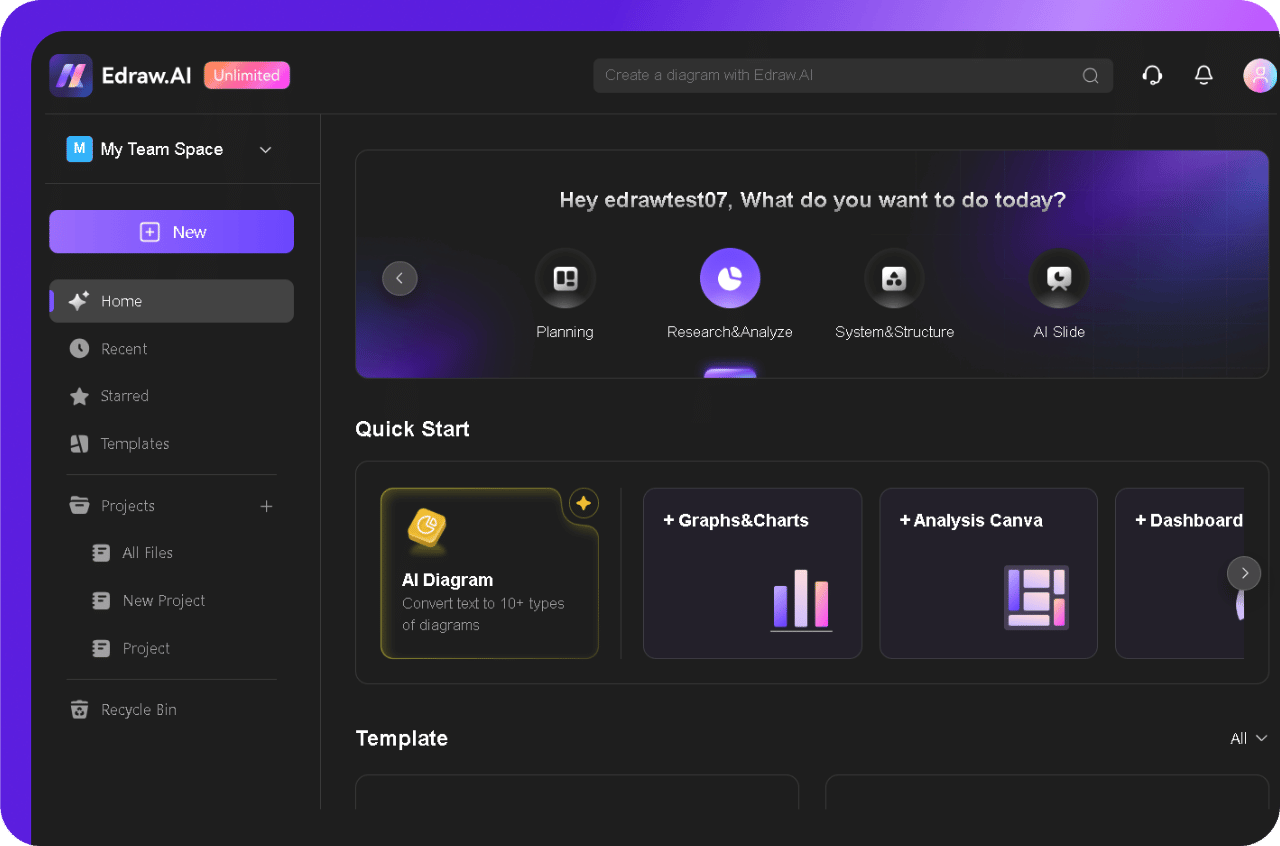
Step 1Access the AI Graph Generator
- Sign up for free to get started or Log In to your account.
- Once in, explore the categories.
- Click on Research&analyze. Select AI Diagram from the Quick Start section.
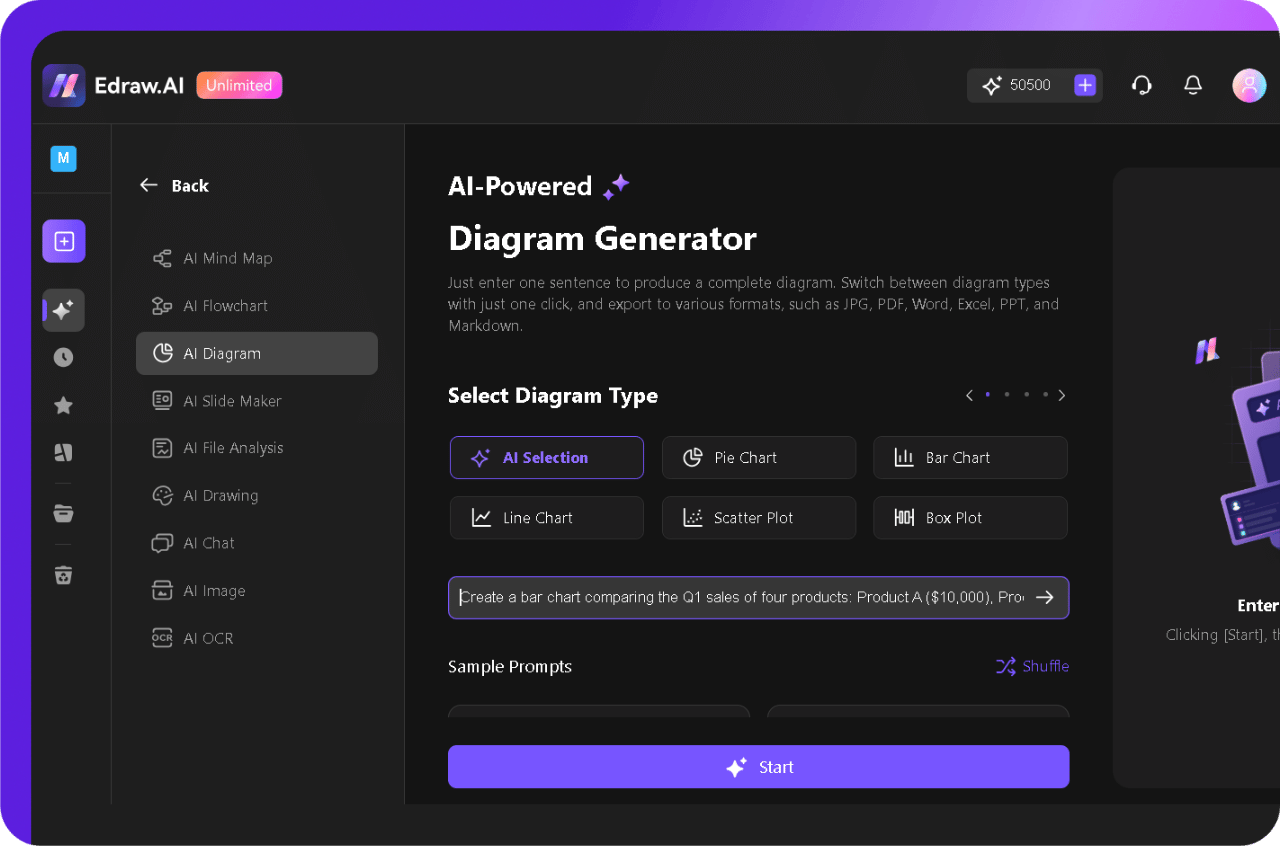
Step 2Describe the Graph You Need
- Select Diagram Type or let the AI Selection option do that based on your prompt.
- You’ll see a text box where you can enter a description of the graph you need.
- Prompt in plain English.
- Example Prompt:
"Create a bar chart comparing the Q1 sales of four products: Product A ($10,000), Product B ($15,000), Product C ($7,500), and Product D ($12,000). Use a visually appealing color palette, with each product represented by a distinct color. Add clear labels for the axes (X-axis: Product Name, Y-axis: Sales in USD). Display the exact sales amount above each bar. Order the bars from highest to lowest sales. Follow each and everything mentioned.”
- Be specific with essential details, for instance:
- Graph Type (bar chart, pie chart, line graph, etc.)
- Categories (e.g., products, departments, months)
- Values (numerical data for comparison)
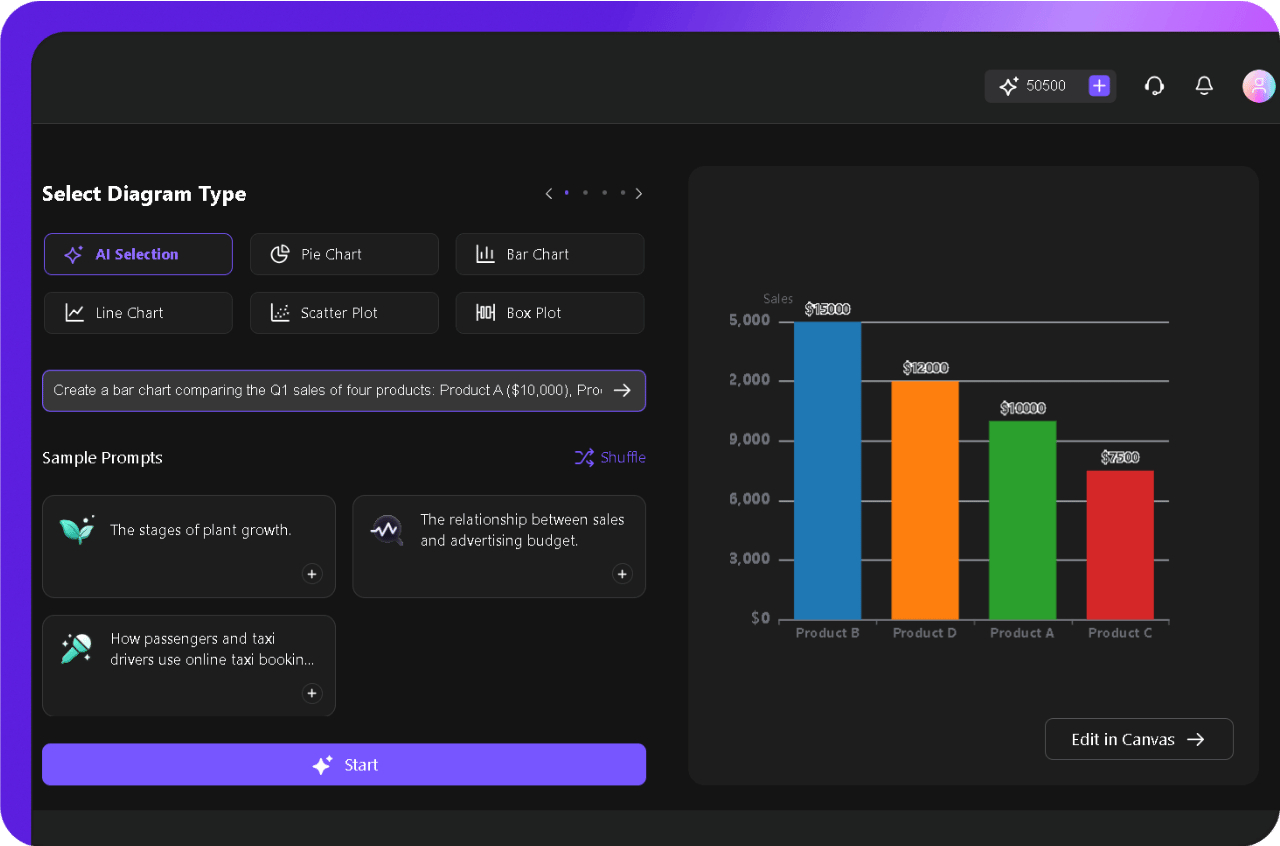
- After prompting, hit the Start button.
- Edraw.AI will process your request instantly and generate a fully formatted graph in seconds.
Step 3Edit and Customize Your AI-Generated Graph (Optional)
- Once generated, click Edit in Canvas.
- You’ll be redirected to the editing workspace, where you can make modifications.
- Click and drag the edges of the graph to resize it.
- You might need to modify the chart (if there are any inconsistencies).
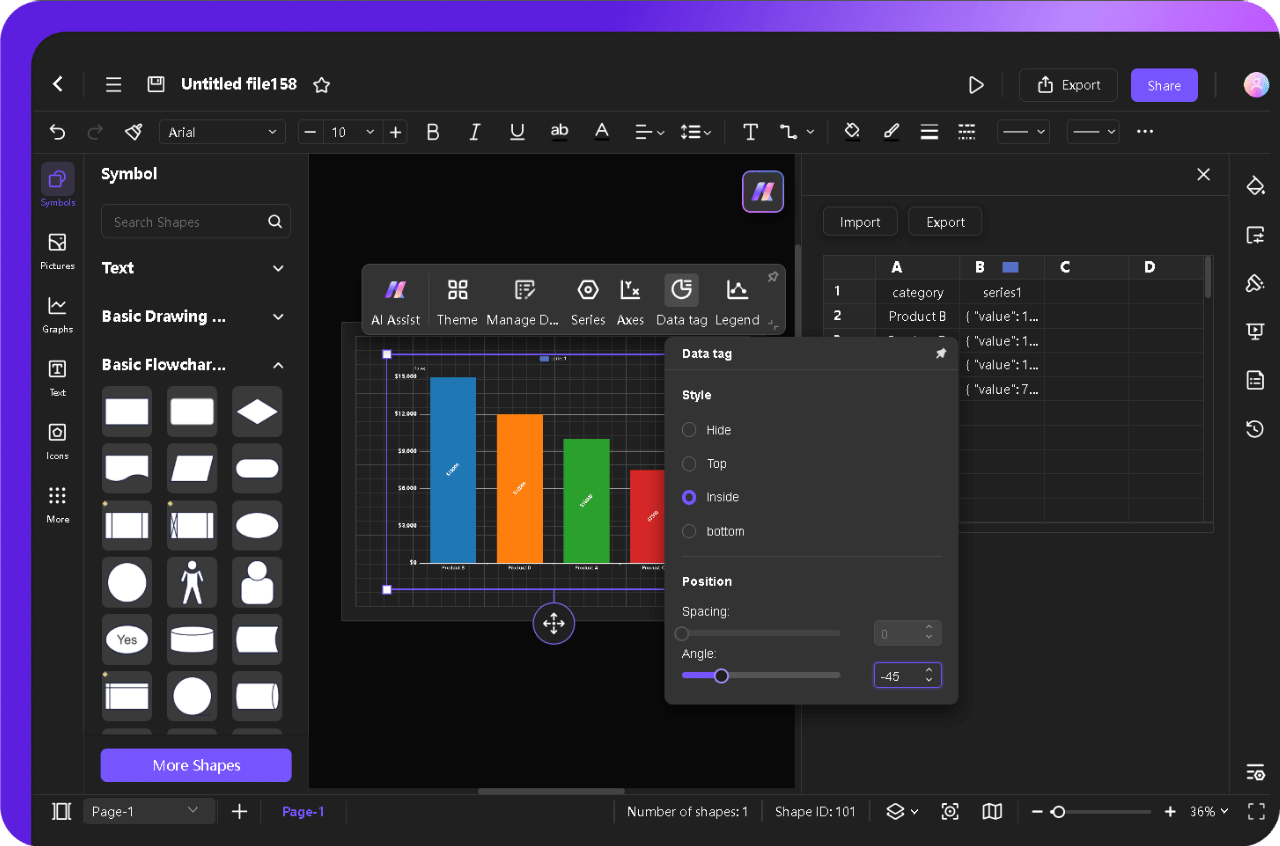
- From the pop-up menu, go to Manage Data to update your data as needed.
- You can also import your data from Excel using the Import button to select your data file.
- It helps your graph update automatically when you update your Excel data.
- The Data tag option lets you modify your tags' style and position (spacing and angle).
- Use the Legend option in the pop-up menu to reposition the legend.
- You can explore the left side of the Symbol library to add required shapes, symbols, icons, etc., to enhance its look. (Search for specific items.)
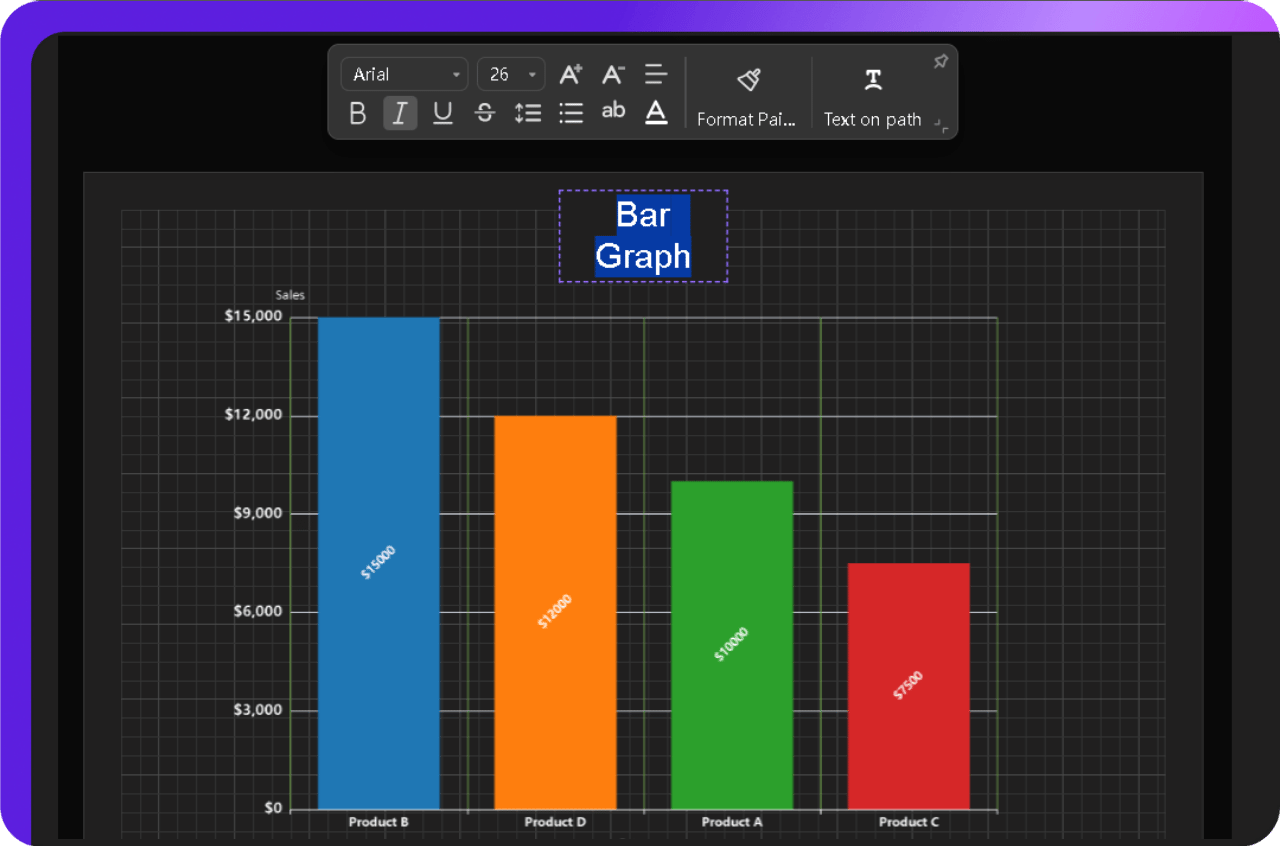
- Double-click anywhere to add your text. For example, add a title and modify the text from the pop-up menu. Adjust fonts, style, size, color, etc.
- Click and drag it to relocate it where you want.
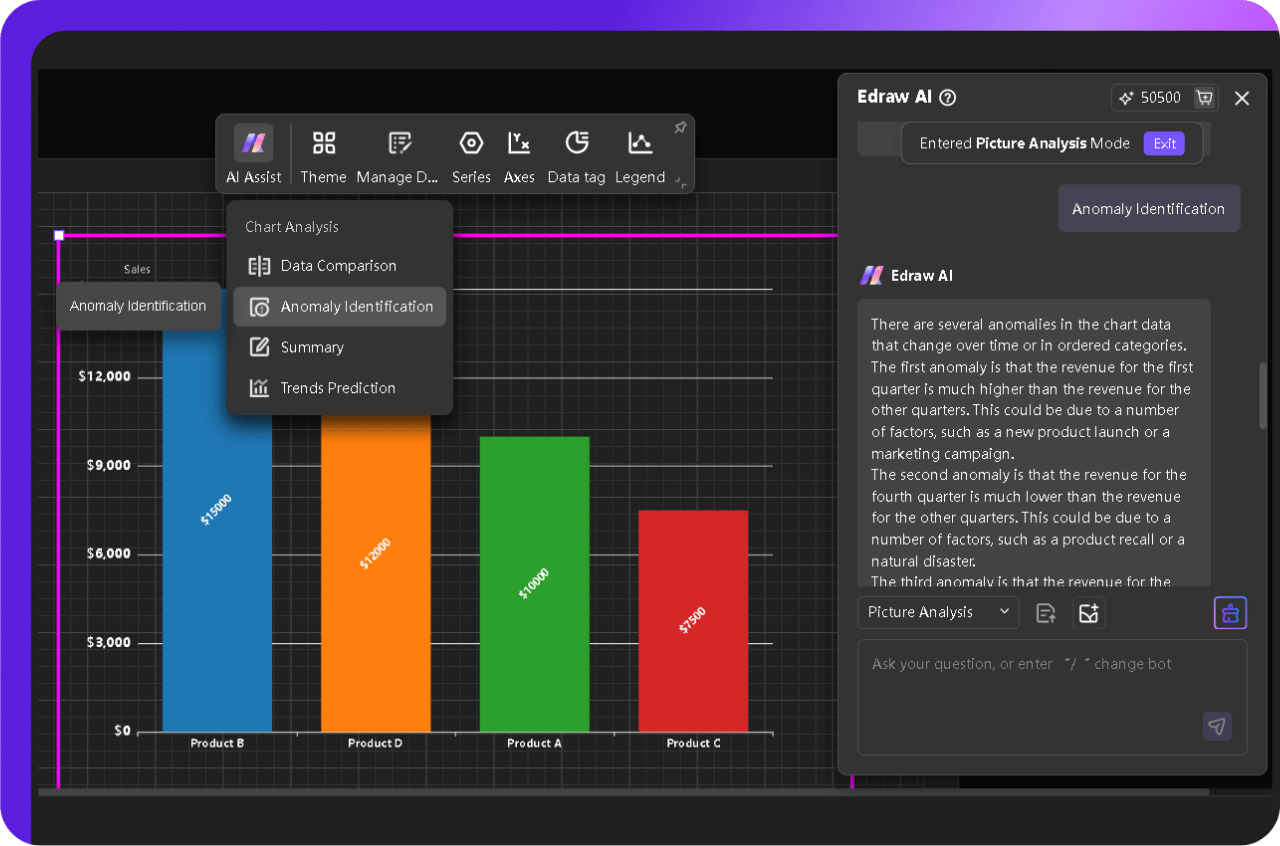
- The AI Assist button helps you with Data Comparison, Anomaly Identification, Summary, and Trends Prediction.
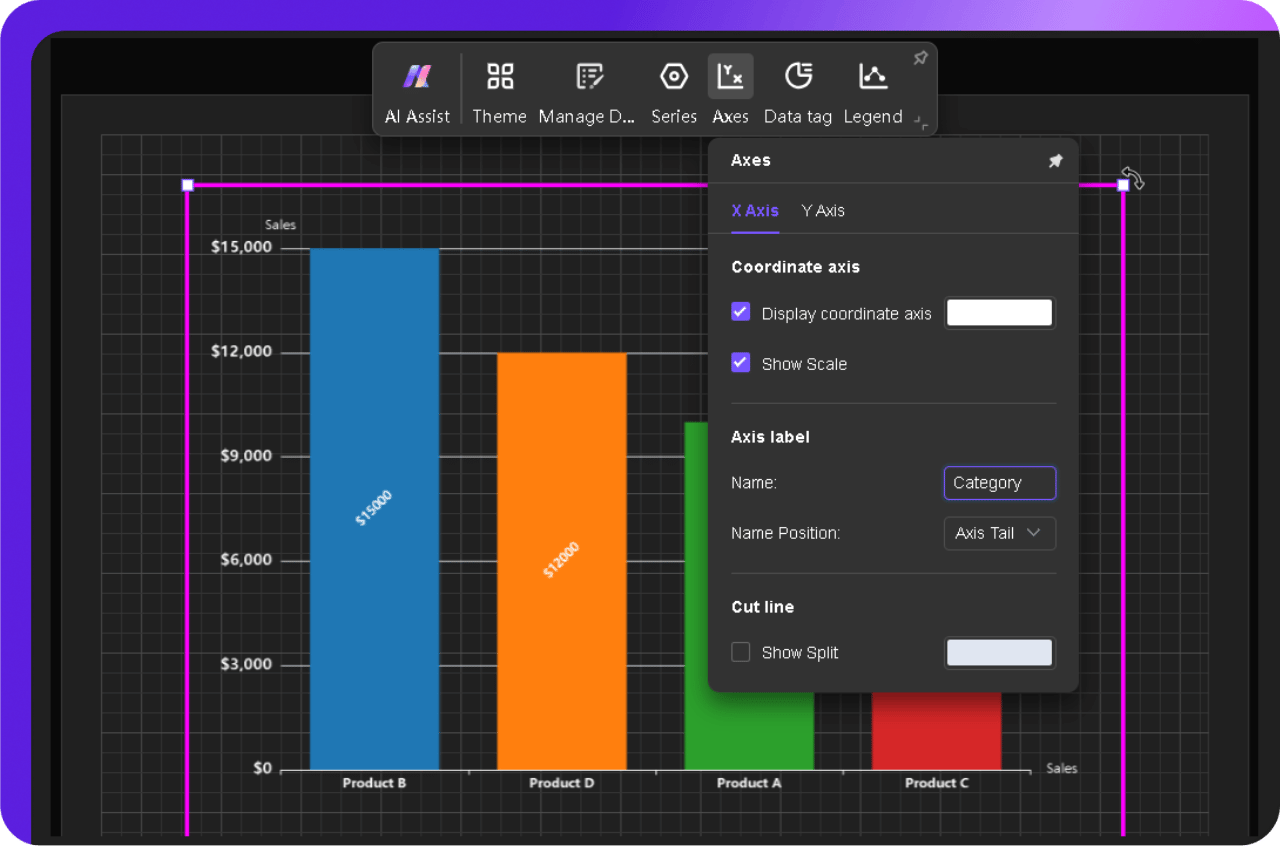
- Tap on Axes to modify the X-Axis and Y-Axis. Adjust the Coordinate axis, Axis label, and Cut line with a few clicks.
Step 4Save & Export the Graph
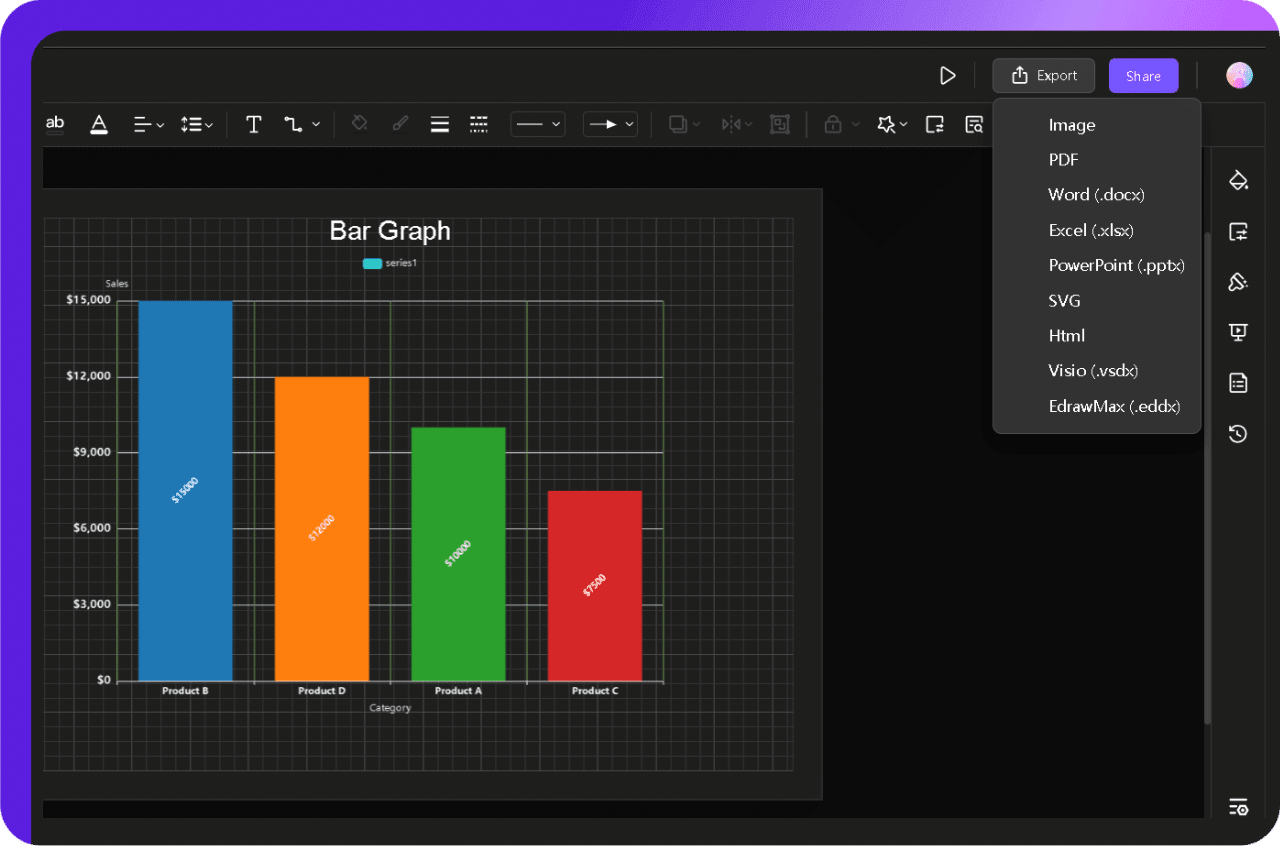
- Once finalized, hit the Export button from the right top menu and select your desired format from the multiple available options:
- PNG/JPG for images
- PDF for documents
- PPTX to use in PowerPoint
- Excel (XLSX) to keep numerical data
- And more.
This Method Is Best For:
- Beginners who want a fully automated graph in seconds.
- Users with no prior design skills.
- Anyone in a hurry who just needs a quick graph.
Best Practices for Creating Graphs
I’ve seen too many graphs that look impressive at first but fail when it comes to clarity. Overcomplicated designs, misleading scales, or excessive colors make even the best data useless. Here’s what actually works:
- Define the Purpose First: Before opening any tool, ask: What do I need to communicate? A clear objective ensures that the graph presents information effectively.
- Pick the Right Graph Type: Bar charts compare values, line graphs show trends and pie charts display proportions. Choose based on your data, not personal preference. If unsure, test different formats.
- Keep Labels Clear and Direct: Axes, legends, and data points should be instantly readable. If a graph needs separate explanations, it’s not clear enough.
- Avoid Unnecessary Decorations: 3D effects, gradient backgrounds, and shadows add clutter, not clarity. A clean layout always wins over flashy designs.
- Use Consistent and Distinguishable Colors: Colors should differentiate data points without overwhelming the viewer. Ensure contrast and check for readability in grayscale.
- Check Scale and Proportions: Inconsistent axis scaling can distort meaning. Keep numerical spacing uniform and start at zero unless justified.
- Test on Different Devices: A graph that’s readable on a monitor may be illegible on a phone. Adjust font sizes and spacing accordingly.
- Validate Your Data: Errors in values or mismatched categories undermine credibility. Always double-check inputs before finalizing.
A great graph doesn’t just display numbers—it tells a story. Stick to these principles, and yours will as well.
Why Use Edraw.AI to Create Graphs?

Many graphing tools add more work than they remove. Formatting issues, rigid layouts, and endless manual adjustments slow things down.
Edraw.AI changes that. With AI automation and deep but easy customization, graph-making is simplified without sacrificing quality.
How It Stands Out?
- AI Automation – Describe what you need, and Edraw.AI builds the graph instantly. No tweaking is required.
- Flexible Customization – Change layouts, colors, labels, and styles without frustration.
- Massive Template & Symbol Library – 700+ templates and 26,000+ symbols mean you’ll always find the right fit.
- Cloud & Collaboration – Access your projects anywhere and share them.
- Seamless Data Import – Pull data from Excel to keep the graphs updated as you do the Excel file.
It's fast, intuitive, and effortlessly delivers polished visuals.
Conclusion
Many graph-making tools I’ve tried suffer from the same flaws: they either overcomplicate things or don’t let you customize enough.
Edraw.AI offers a solid and reliable solution. AI handles quick generation, while manual tools provide easy customization features. So you can fine-tune details as required.
If you need a graph that’s easy to create yet highly customizable, Edraw.AI gives you the best of both worlds. It’s about efficiency without sacrificing quality.
So, if you’re ready to create graphs effortlessly, try Edraw.AI for free today!
Put the "Try online for free” button here.
FAQs
FAQ
-
What is the AI tool to make a bar graph?
Edraw.AI is a powerful AI-driven graph maker that allows users to create bar graphs instantly. -
Is Edraw.AI free to use?
Edraw.AI offers a free version with basic features. However, premium plans unlock advanced customization, a larger template library, high-resolution export options, and more. -
What types of graphs can Edraw.AI create?
Edraw.AI supports multiple graph types, including bar charts, line graphs, pie charts, and more. The AI can automatically select the best graph format based on your input or let you choose manually. -
Does Edraw.AI work online, or do I need to download software?
Edraw.AI is a web-based tool, so you can create and edit graphs online without downloading anything.